Who Are Philadelphia’s Immigrant Entrepreneurs?
Foreign-born Philadelphians represent a third of all city business owners, running construction firms, restaurants, shops, and more

Overview
From corner grocers and restaurateurs to construction contractors and biotech founders, immigrants make up around a third of all Philadelphia entrepreneurs and growing.1 That’s double immigrants’ share of the city’s population and higher than the share of foreign-born business owners in many comparison cities and the country overall. Who are these entrepreneurs, what kinds of businesses do they run, and how do they finance themselves?
This fact sheet provides a demographic profile of Philadelphia’s self-employed immigrant entrepreneurs, using the latest-available survey data from the U.S. Census Bureau on city residents who work for themselves at their own unincorporated or incorporated firms, working at least 15 hours a week at a business located within or outside the city, including suburban areas. Some may own multiple businesses.2 They may have many employees or work alone. The survey, however, counts only individual city residents, not firms or establishments. Importantly, it does not include owners or founders of larger companies or most corporations, such as technology and life science firms.
Philadelphia’s self-employed immigrant entrepreneurs numbered around 21,000 in 2022. Many lived in Lower and Far Northeast Philadelphia, with around a quarter doing business outside the city in the surrounding suburban counties or beyond. According to national studies, immigrant-owned businesses, on average, employ fewer people than businesses with U.S.-born owners but play an important role in stoking the broader economy.3 For Philadelphia, data shows that immigrant entrepreneurs can foster neighborhood amenities and sometimes rejuvenation, provide jobs for themselves and others, help bolster the city’s relatively weak small-business ecosystem, and attract and support more immigrants, who have been the biggest source of new residents for Philadelphia.4
Business sectors with immigrant owners
Construction firms, restaurants, taxi and trucking companies, and housecleaning services were the most common types of businesses owned by Philadelphia’s self-employed immigrants in the 2018-22 period. (See Figure 1.) In contrast, the top sectors for U.S.-born entrepreneurs were construction; management, scientific, and technical consulting; and independent (freelance) art, writing, and performance services.
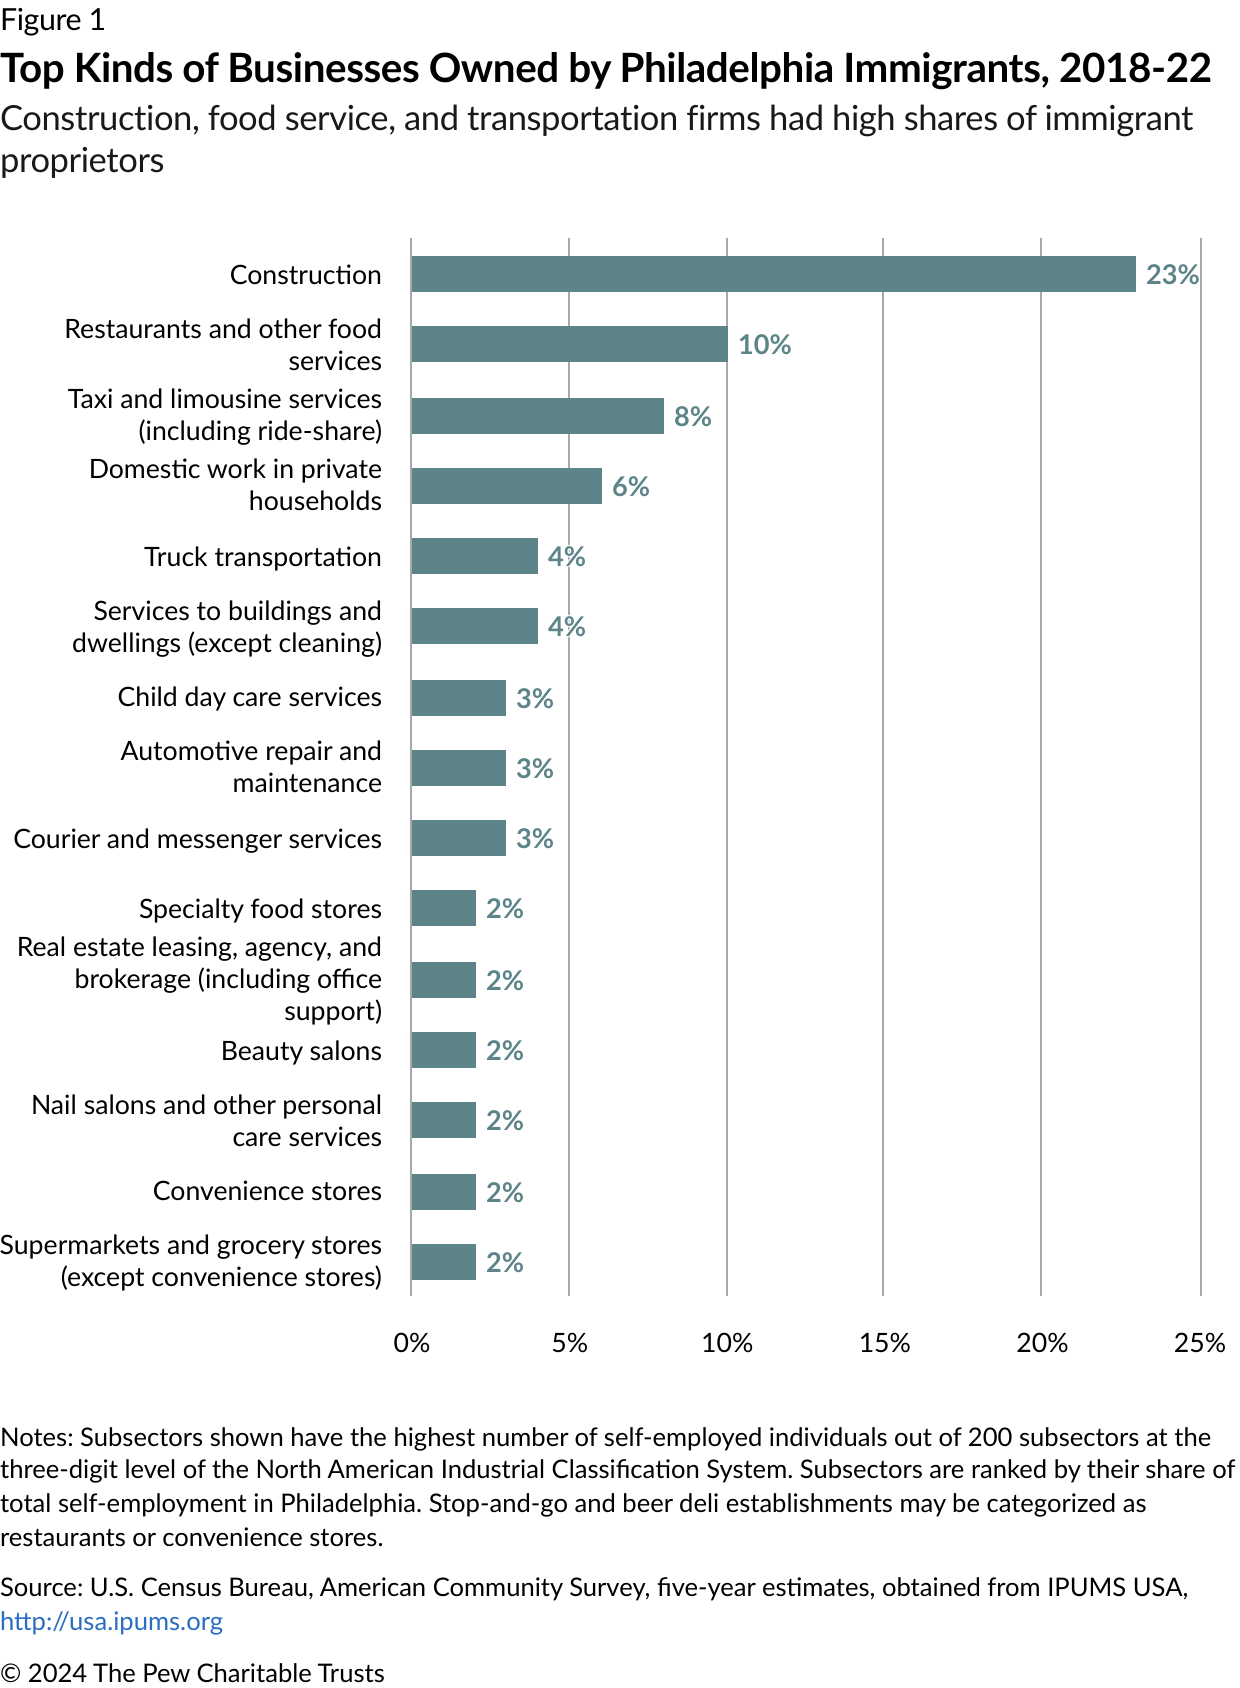

National studies have found that immigrant entrepreneurs who create jobs tend to hire other immigrants they know from their home countries or with whom they share a language.5 Some business sectors also have become associated with particular nationalities, either because people brought those specializations with them or coalesced around opportunities after arrival. Philadelphia’s specialized groupings of entrepreneurs include Brazilians and Guatemalans in construction, Chinese in food establishments, and Dominicans in transportation, according to The Pew Charitable Trusts’ analysis of 2018-22 census data.
Education and entrepreneurship
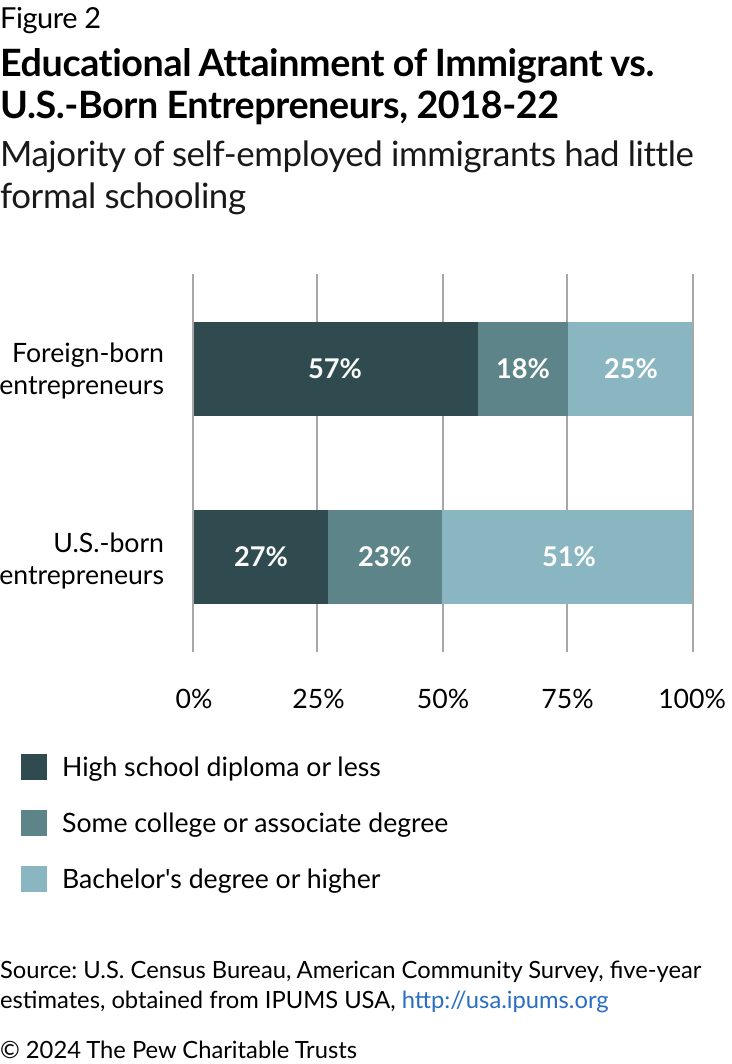
In the 2018-22 period, a majority of all self-employed immigrants in Philadelphia ages 25 and older had a high school diploma or less education. For these individuals, there may have been limited choices other than entrepreneurship. Indeed, Philadelphia immigrants with college degrees were much less likely to be self-employed entrepreneurs than those without college degrees, as measured by the Census Bureau’s self-employment category, which does not capture owners or founders of large companies.6 In contrast, the majority of Philadelphia’s U.S.-born self-employed entrepreneurs had college degrees. (See Figure 2.)

Self-employment was also associated with lower English proficiency. Among the city’s self-employed immigrant entrepreneurs, 40% reported that they struggled with English, greater than the 25% among immigrant workers who were not self-employed business owners. It should be noted that these figures don’t take into account people’s level of educational attainment (discussed earlier) or national origin (discussed later), which can also affect entrepreneurship rates.
The combination of little formal schooling, limited English proficiency, and in some cases a lack of work authorization or outright discrimination usually leaves just one lawful option, which economists call “necessity entrepreneurship.” It refers to people who go into business out of necessity to survive financially as distinct from those who had a job but decided to take an opportunity to create new products or open their own business—a variant called “opportunity entrepreneurship.” Work authorization plays a role because, under U.S. immigration and corporate law, setting up a U.S. business is simpler and faster for some noncitizen immigrants than obtaining federal permission to get a job and earn wages.7
Measuring the share of Philadelphia immigrants who were either necessity or opportunity entrepreneurs—or a combination of the two—was beyond the scope of this report. But the distinction can be crucial for immigrants, their families, and Philadelphia itself: Research shows that necessity entrepreneurship is more common among immigrants than among U.S.-born residents but less likely to lead to business expansion and hiring.8 Some business advocates also say that necessity entrepreneurs are less likely to hand off businesses to their children, who may prefer different livelihoods or business ventures.
“The last thing these [parents] want is for their child to run their small business,” said David Oh, a former City Council member. “They say, ‘Become a doctor, a lawyer, or a corporate executive.’ It is more important for people with a history of [facing] discrimination to become a respected and accepted member of society. You will be victimized unless you have standing in society.”
Entrepreneurship rate
In addition to education, language, and work status, national origin also plays a role in the share of immigrants who decide to become entrepreneurs, as reflected in the entrepreneurship rate. Immigrants from China and the Dominican Republic made up the largest foreign-born groups in Philadelphia in the 2018-22 period, but they didn’t have the highest entrepreneurship rates. Among the 16 largest nationality groups, immigrants from Brazil could claim to be the most entrepreneurial, with nearly 1 in 5 identifying themselves as self-employed business owners in 2018-22, the majority in the construction sector. Next on the list were Guatemalans and South Koreans. (See Table 1.)
“When I came here, Brazilians used to work for the Portuguese and Americans. Now it’s in reverse: They work for themselves and own their own companies—and now they are hiring the Brazilians themselves,” Simone Salgado, a Brazilian-born entrepreneur in Philadelphia since 2012 and owner of S. Group Investments, said in a 2023 interview with Pew.
Table 1
Entrepreneurship Rate of 16 Largest Immigrant Groups, 2018-22
Ranked by rate; several groups were highly entrepreneurial
| Entrepreneurship rate (share of group who are self-employed immigrants) | Share of all self-employed Philadelphia immigrants | Share of all Philadelphia immigrants | |
|---|---|---|---|
| Brazil | 19% | 9% | 3% |
| Guatemala | 11% | 3% | 2% |
| South Korea | 11% | 3% | 2% |
| Mexico | 9% | 3% | 2% |
| China | 8% | 14% | 11% |
| Dominican Republic | 8% | 13% | 10% |
| Albania | 7% | 2% | 2% |
| Cambodia | 6% | 2% | 2% |
| Nigeria | 6% | 2% | 2% |
| Vietnam | 5% | 4% | 5% |
| Jamaica | 4% | 2% | 4% |
| Ukraine | 4% | 1% | 2% |
| Liberia | 2% | 1% | 2% |
| Haiti | 2% | 1% | 3% |
| Philippines | 2% | 1% | 2% |
| India | 2% | 2% | 5% |
|
Notes: This list is limited to nationality groups with at least 4,000 residents in Philadelphia, as counted by the U.S. Census Bureau’s American Community Survey; smaller groups not shown may also have high entrepreneurship rates. Source: U.S. Census Bureau, American Community Survey, five-year estimates, obtained from IPUMS USA, http://usa.ipums.org |
Financing and support of immigrant-owned businesses
The financial health and resources of immigrant-owned businesses in Philadelphia are difficult to discern, because hard data on privately held companies is not readily available, especially at the city level. Research by the Federal Reserve Bank at the national level in 2023 found that immigrant entrepreneurs, more so than U.S.-born entrepreneurs, rely on investments from family and friends to start or sustain their businesses. They apply for financing at roughly the same rates as U.S.-born entrepreneurs, but majority immigrant-owned firms had higher rates of denial or partial approval.9 Perhaps in reaction to such difficulties, some immigrants pool and obtain money through informal, unregulated, private financing associations within their communities and language groups, known as lending circles (or rotating savings and credit associations, known as “ROSCAs” to economists). Research has found that such financing vehicles have played a central role in business and personal finance for various immigrant groups.10
The national figures ring true to one Philadelphia lender, who estimated that half of immigrant entrepreneurs in the city rely partly on lending circles: “For them, it is a trusted source of money,” said Kersy Azocar, president and CEO of Greenline Access Capital, an immigrant-owned lending institution that works with immigrant entrepreneurs. “Many of them are fearful of financial institutions and have experienced financial traumas.”
In Philadelphia, various financing organizations and programs, along with the Office of Immigrant Affairs, are dedicated to assisting immigrant entrepreneurs. It was beyond the scope of this report to assess these programs’ strategies and the total value of their funding, but their mere presence suggests that civic and business leaders are aware of this cohort’s importance for the city’s economic growth and stability.
Read our accompanying reports about foreign-born workers and other installments in this series about Philadelphia’s evolving populations and how immigrants are diversifying the city.
Endnotes
- About 57,000 Philadelphia residents in 2022 reported working for themselves at incorporated or unincorporated businesses that they personally owned. Separate measurements of the businesses themselves in earlier years also found that around a third had immigrant owners.
- This measure is based on the U.S. Census Bureau’s category of self-employment in a business that the respondent personally owns. Pew made two modifications to the definitions, explained in the methodology. There are other limitations with the self-employment measurement. See Katharine G. Abraham et al., “Measuring the Gig Economy: Current Knowledge and Open Issues” (working paper, National Bureau of Economic Research, 2020), https://www.nber.org/papers/w24950.
- Sari Pekkala Kerr and William R. Kerr, “Immigrant Entrepreneurship in America: Evidence from the Survey of Business Owners 2007 & 2012,” Research Policy 49, no. 3 (2019): https://dash.harvard.edu/bitstream/handle/1/37366633/kerr%2Ckerr_immigrant-entrepreneurship-in-america.pdf.
- Domenic Vitiello and Thomas J. Sugrue, eds., Immigration and Metropolitan Revitalization in the United States (University of Pennsylvania Press, 2020), https://www.pennpress.org/9780812249125/immigration-and-metropolitan-revitalization-in-the-united-states/.
- Saheel A. Chodavadia et al., “Immigrant Entrepreneurship: New Estimates and a Research Agenda” (working paper, National Bureau of Economic Research, 2024), https://www.nber.org/system/files/working_papers/w32400/w32400.pdf.
- Highly educated immigrants also create or own companies, often found in high-growth technology and life sciences sectors and backed by venture capital firms. Such companies typically are few in number and structured as S corporations or C corporations, which are not captured in the Census Bureau’s self-employment category. See “Choice of Entity for Startups Seeking Venture Capital,” Sandra Feldman, Wolters Kluwer, May 17, 2017, https://www.wolterskluwer.com/en/expert-insights/choice-of-entity-for-startups-seeking-venture-capital.
- “Steps for Starting a Business in the U.S. If You’re Not a U.S. Citizen,” Nellie Akalp, SCORE Association, June 14, 2024, https://www.score.org/resource/blog-post/steps-starting-a-business-us-if-youre-not-a-us-citizen.
- Robert W. Fairlie and Frank M. Fossen, “Defining Opportunity Versus Necessity Entrepreneurship: Two Components of Business Creation” (working paper, National Bureau of Economic Research, 2019), https://www.nber.org/papers/w26377. Maurice Kugler et al., “Self-Employment and Immigration: Opportunity vs. Necessity Entrepreneurship,” George Mason University Interdisciplinary Center for Economic Science, 2022, https://d101vc9winf8ln.cloudfront.net/documents/44664/original/Self-employment_and_Immigration_Opportunity_vs._Necessity_Entrepreneurship_by_Kugler_et.al.pdf?1666363833.
- Federal Reserve Banks Small Business Credit Survey, “2024 Firms in Focus: Chartbook on Immigrant-Owned Firms,” 2024, https://www.fedsmallbusiness.org/search?q=immigrant.
- Tom Akana, “Meet People Where They Are: Building Formal Credit Using Informal Financial Traditions,” Federal Reserve Bank of Philadelphia, 2020, https://www.philadelphiafed.org/-/media/frbp/assets/consumer-finance/discussion-papers/dp20-01.pdf.


Philadelphia's Immigrants


Immigrants' Economic and Fiscal Role in Philadelphia


The Demographics of Immigrant Workers in Philadelphia
ADDITIONAL RESOURCES


