Philadelphia 2025
The state of the city

The Big Picture
As 2025 began, Philadelphia appeared to be entering a new and different phase after years of pandemic-related reverberations. The question is which effects from the past few years will turn out to have been temporary and which will prove more enduring. The answers are beginning to come into sharper focus.
Homicides and shootings, which rose dramatically at the height of the pandemic, have fallen to the lowest levels in a decade. Unemployment rates, which were high in 2020 and 2021, have been relatively low for several years. And the poverty rate continues to decline.
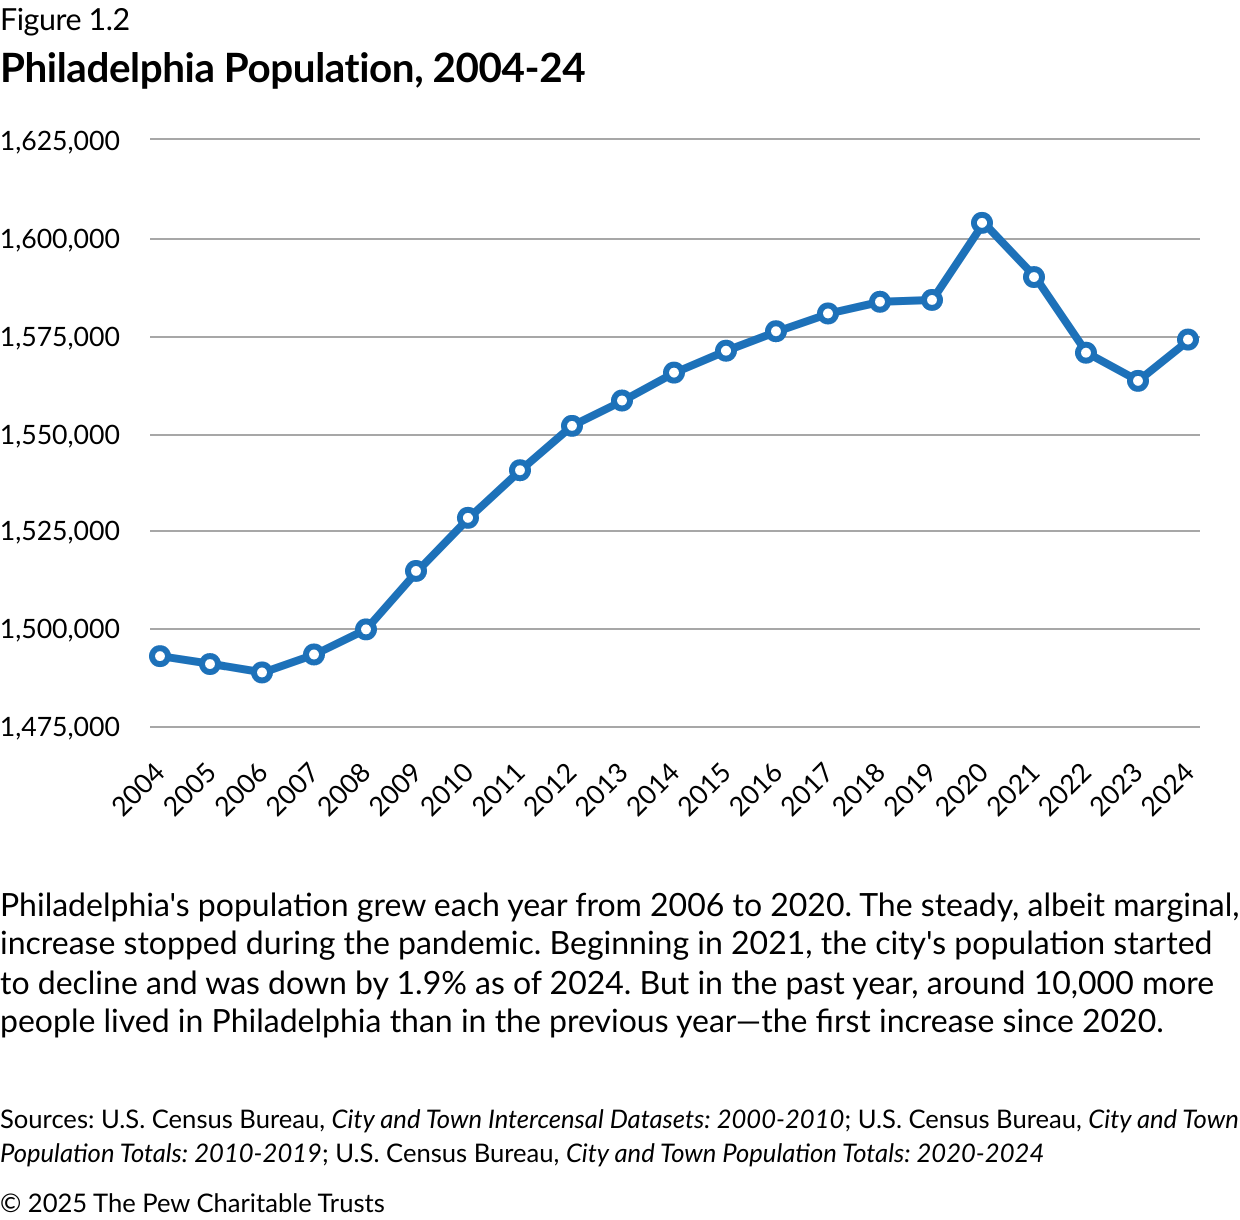
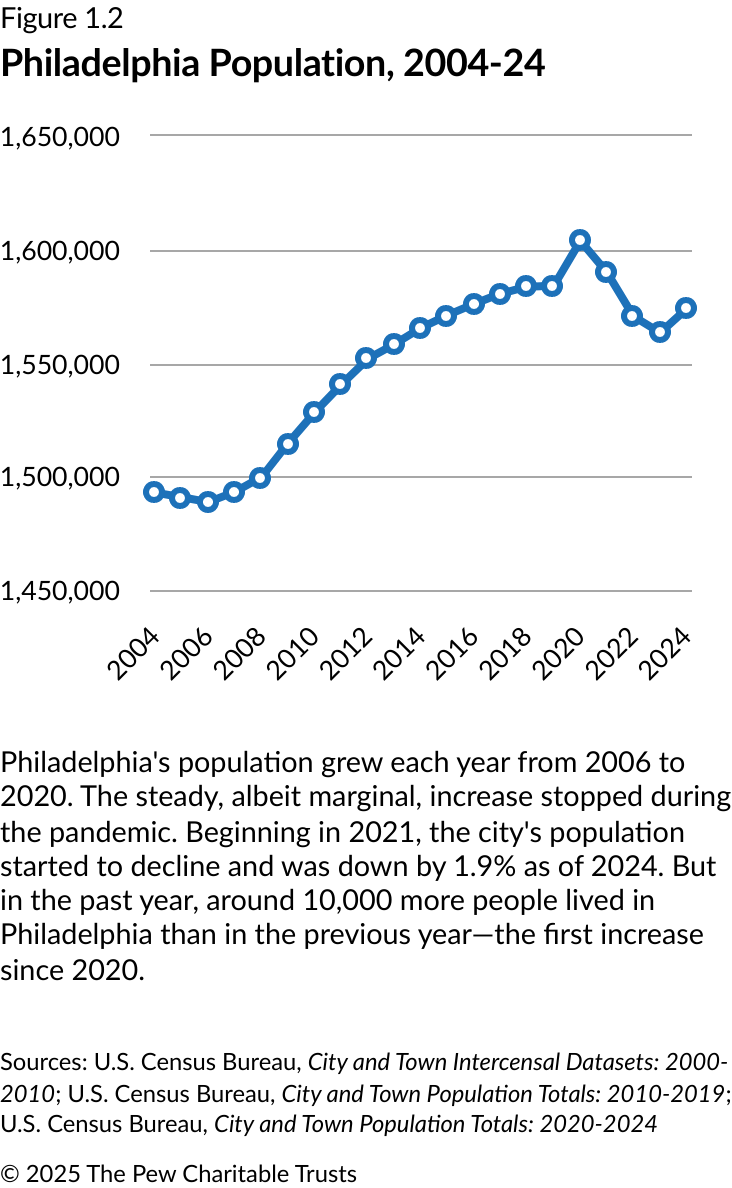
Nevertheless, Philadelphia faces major uncertainties in the form of shifts in federal funding, increasing housing costs, the ongoing opioid epidemic, and a citywide population that has shrunk from its pre-pandemic peak.
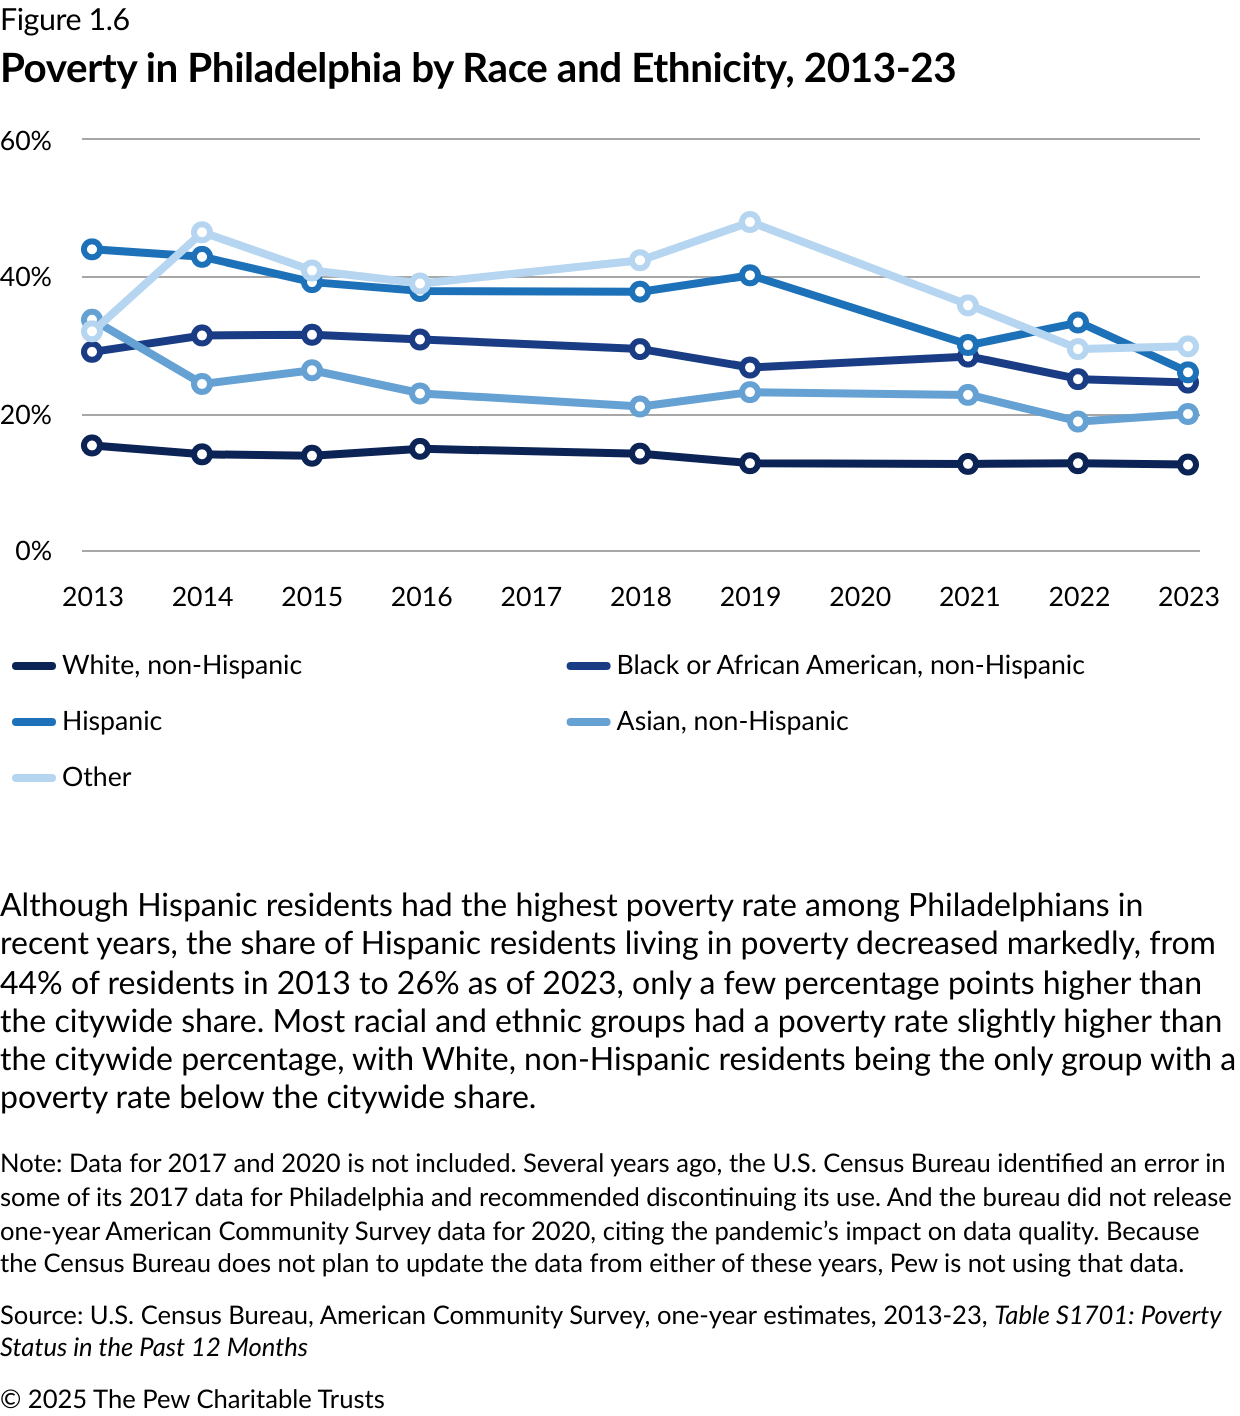
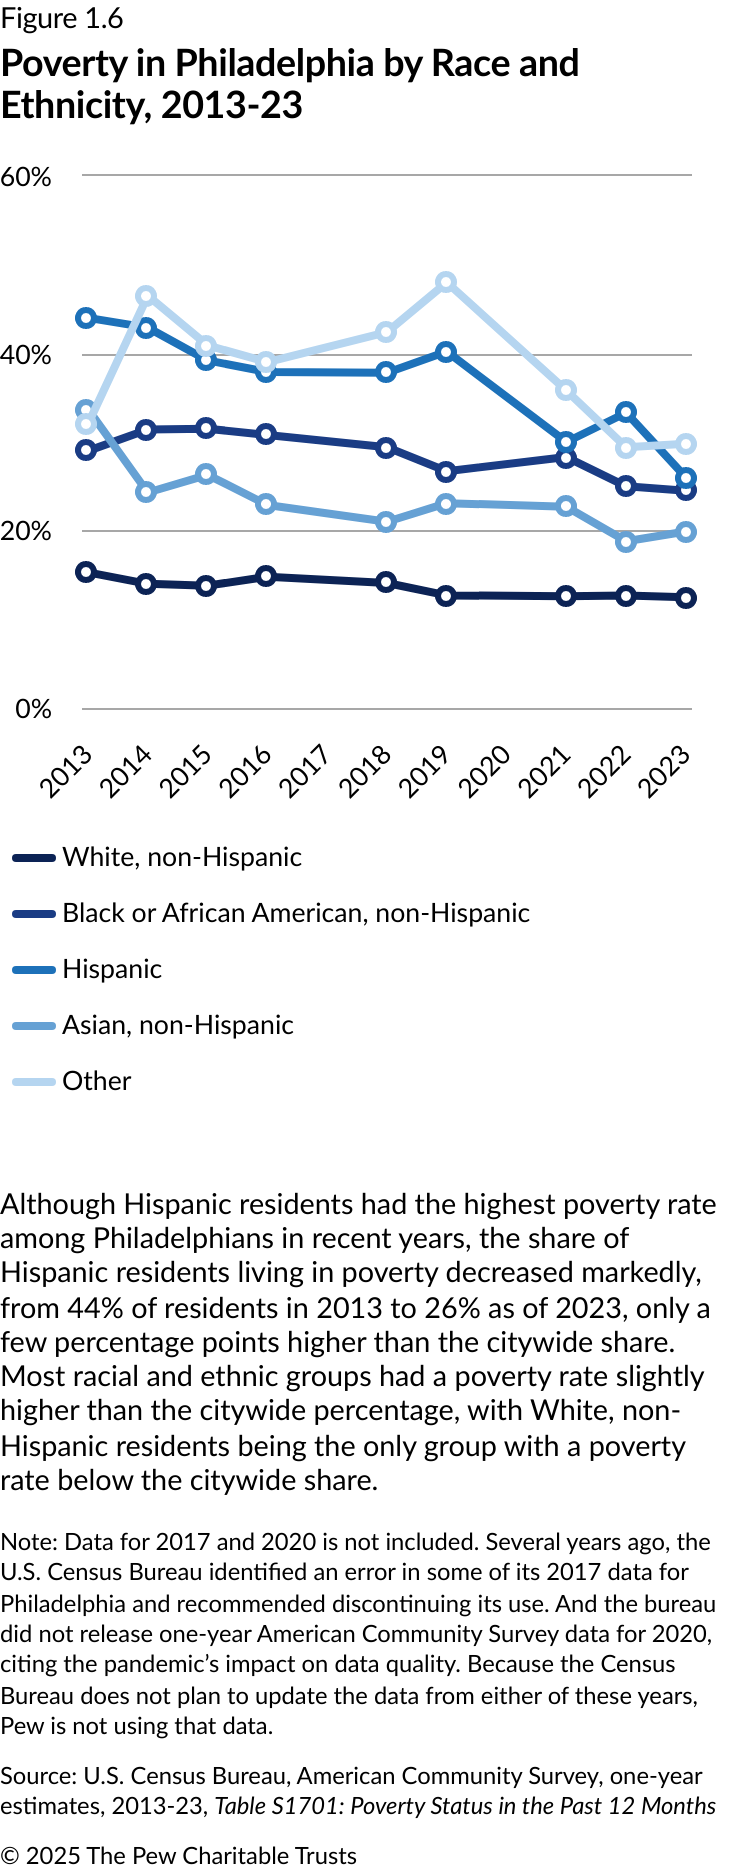
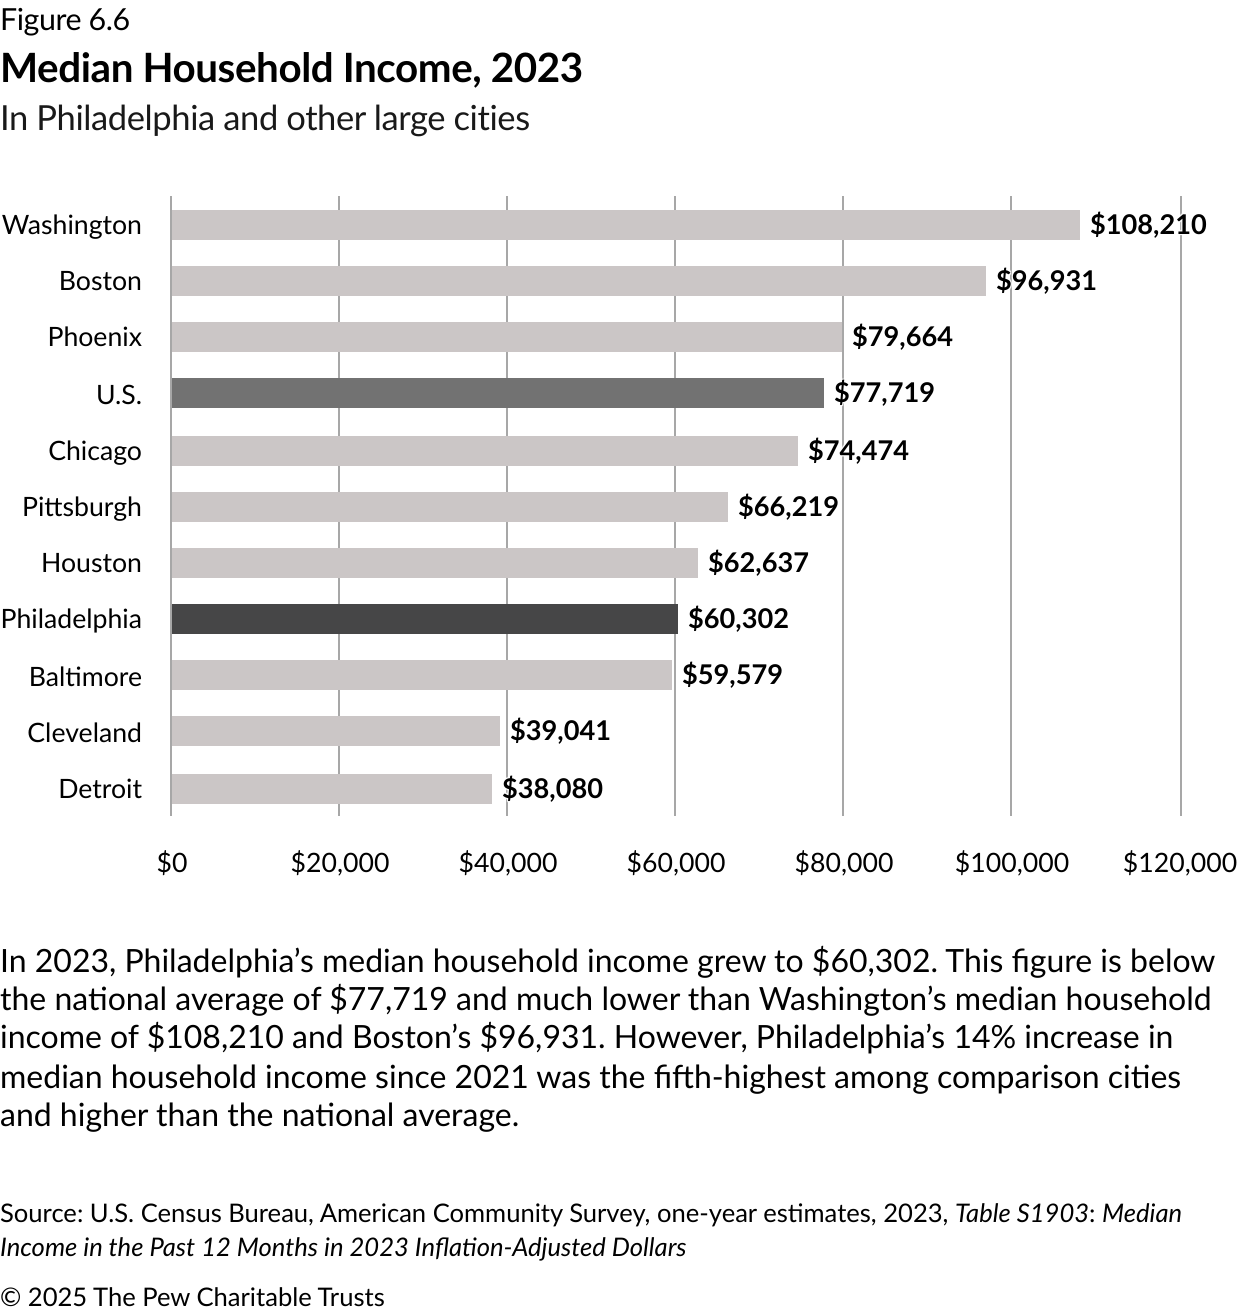
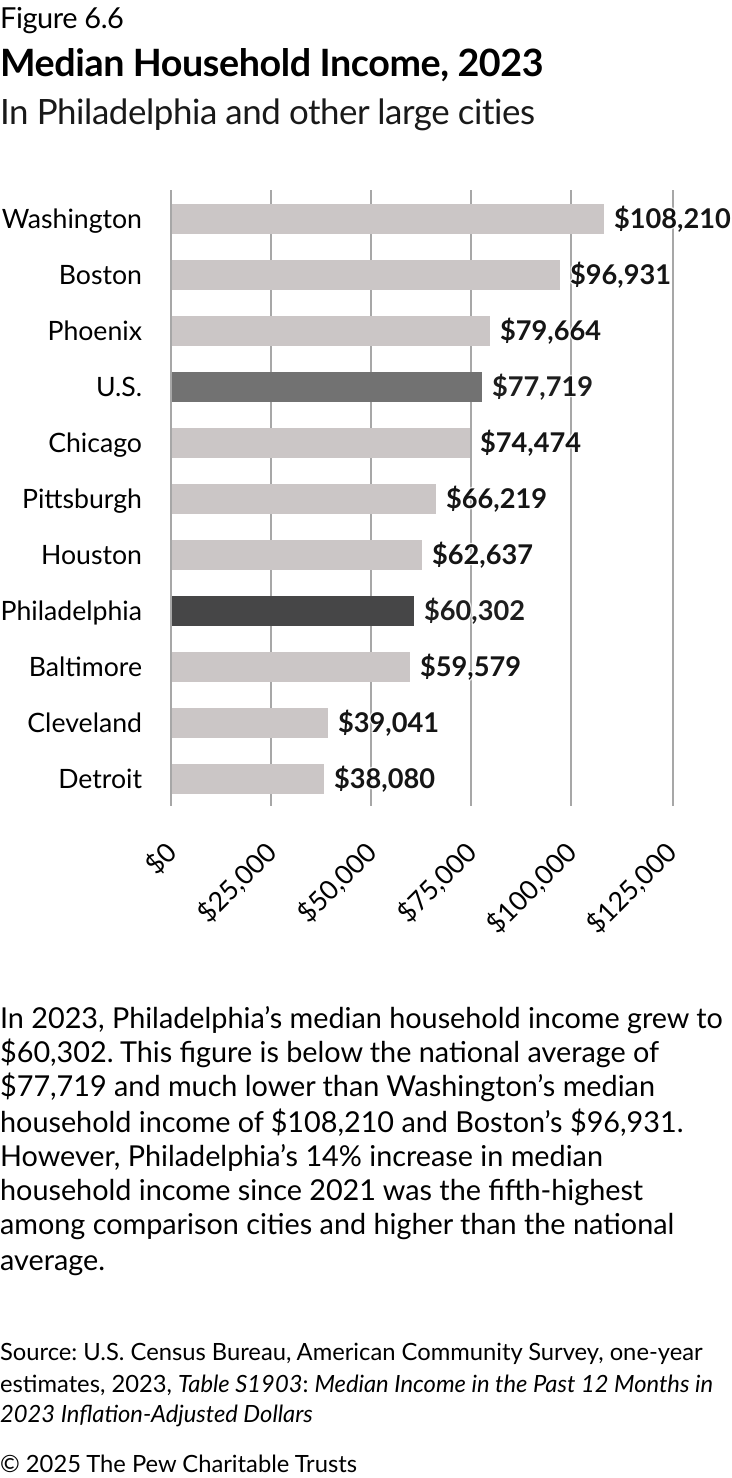
Let’s start with the positives: Philadelphia’s economy continued to show strength last year. The unemployment rate averaged 4.5%, one of the lowest levels in several decades. The city’s poverty rate stood at 20.3%, the lowest since 2000. And the median household income reached $60,302, growing more than in some other cities, albeit with significant income disparities among households by race and ethnicity.

The city government’s fiscal health was strong as well, with Philadelphia’s S&P Global credit rating rising to A+, its highest level in 40 years—a development that will reduce future borrowing costs. Much of the improved rating is attributable to the relative health of the city’s pension fund, which is 65.4% funded, its highest level in 20 years.
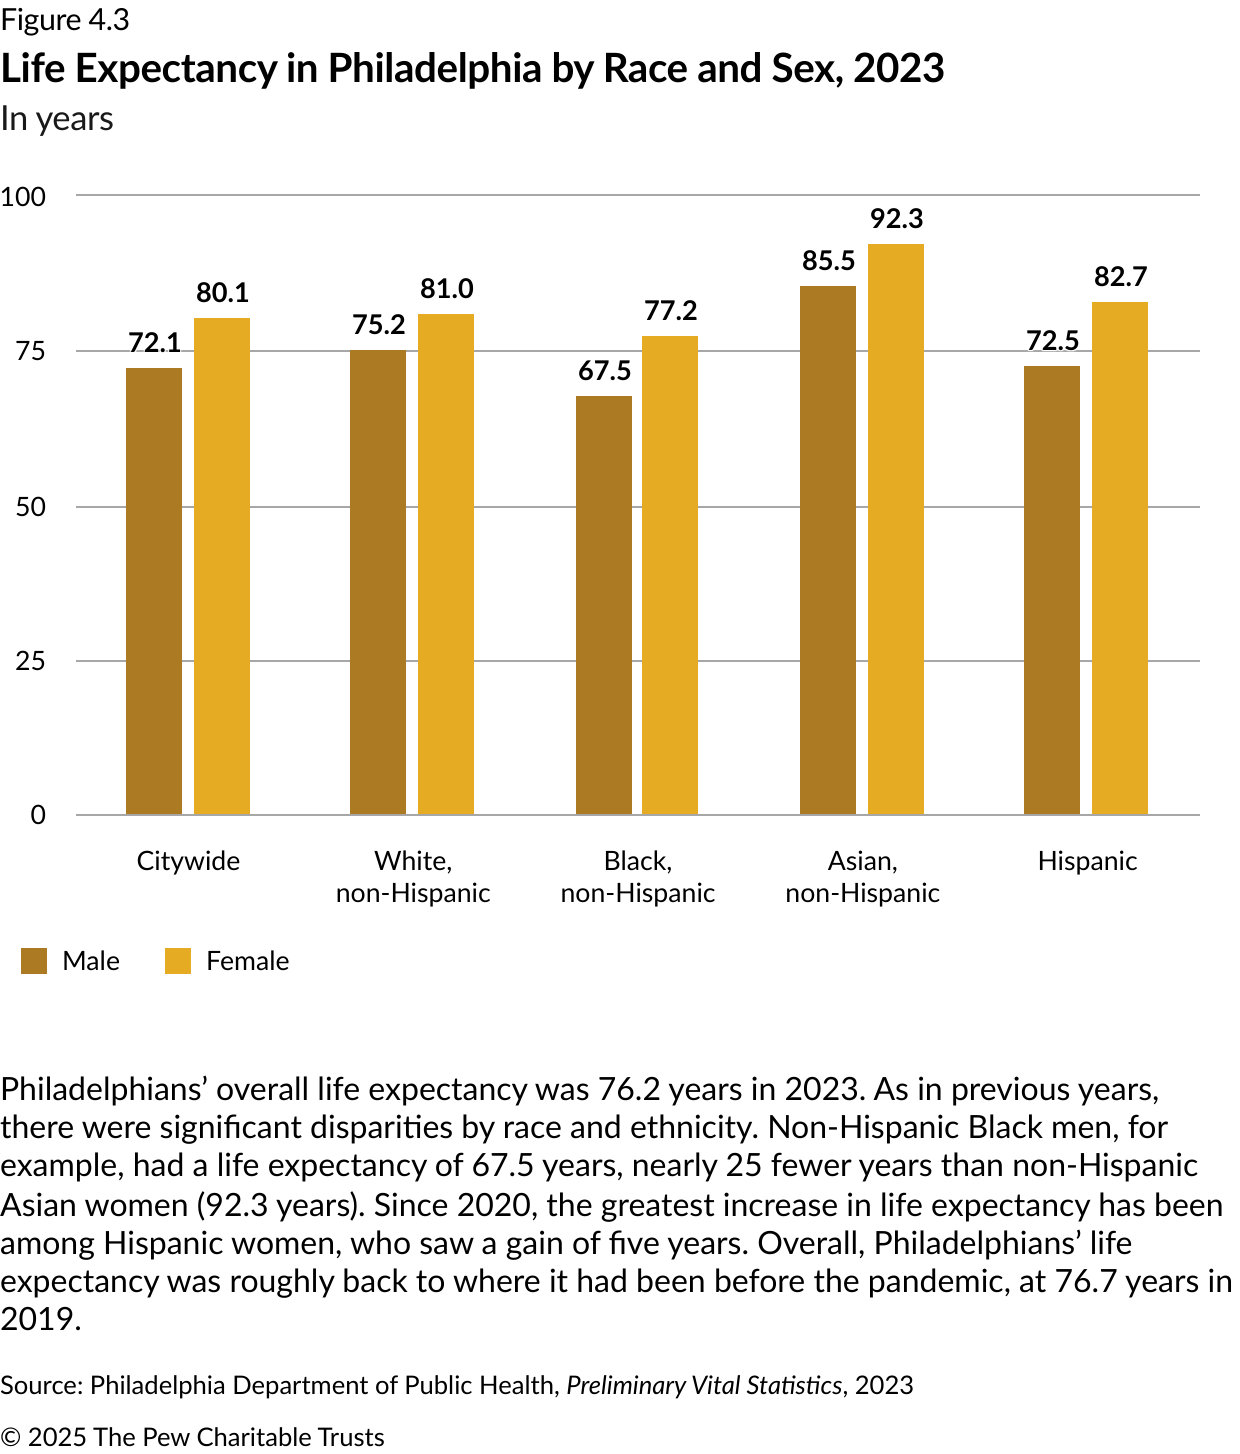
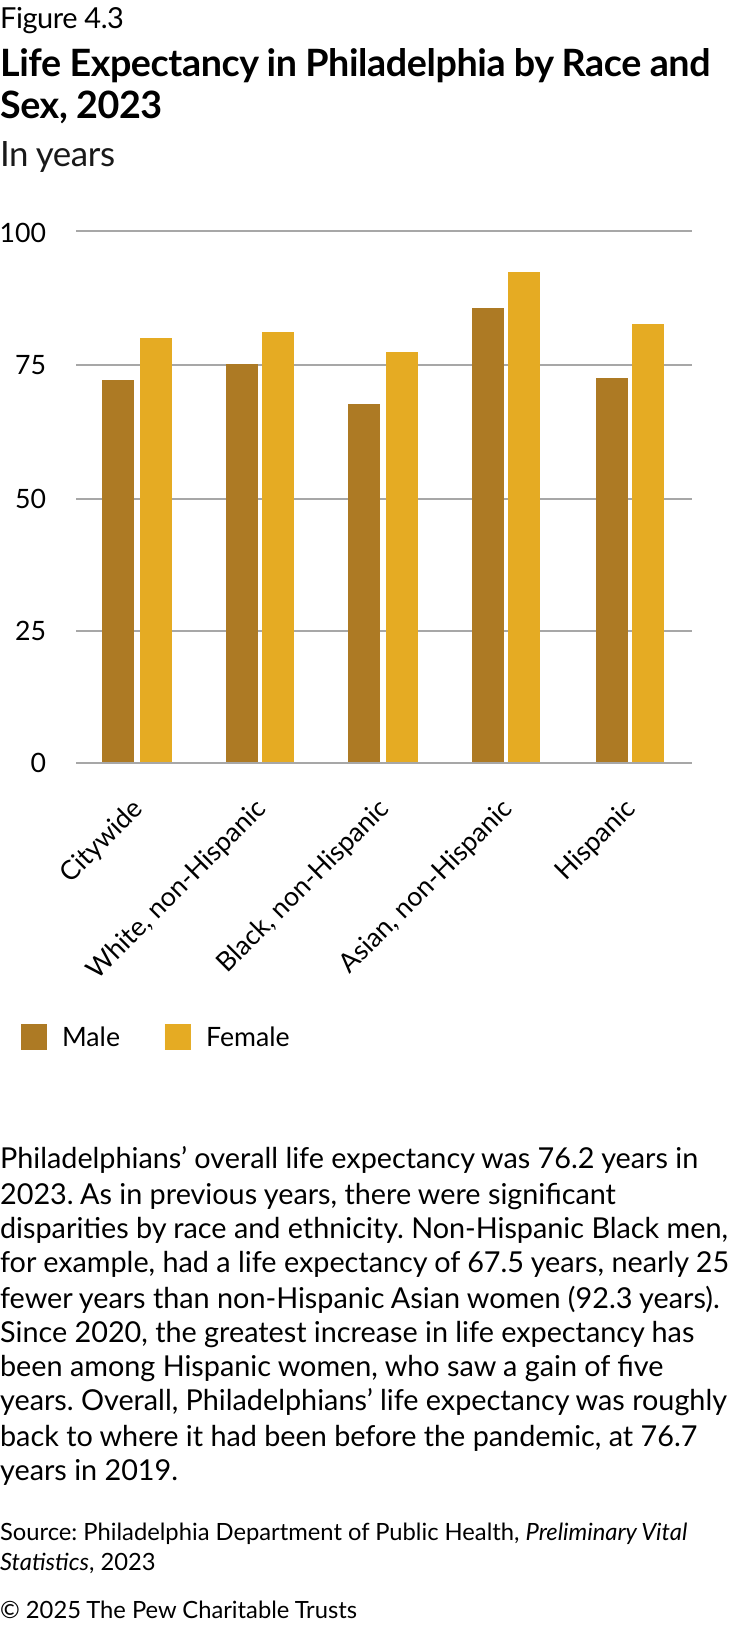
Many data points related to Philadelphians’ health were also encouraging. Only 7.1% of residents reported not having health insurance, and life expectancy rose to 76.2 years, roughly matching pre-pandemic levels.
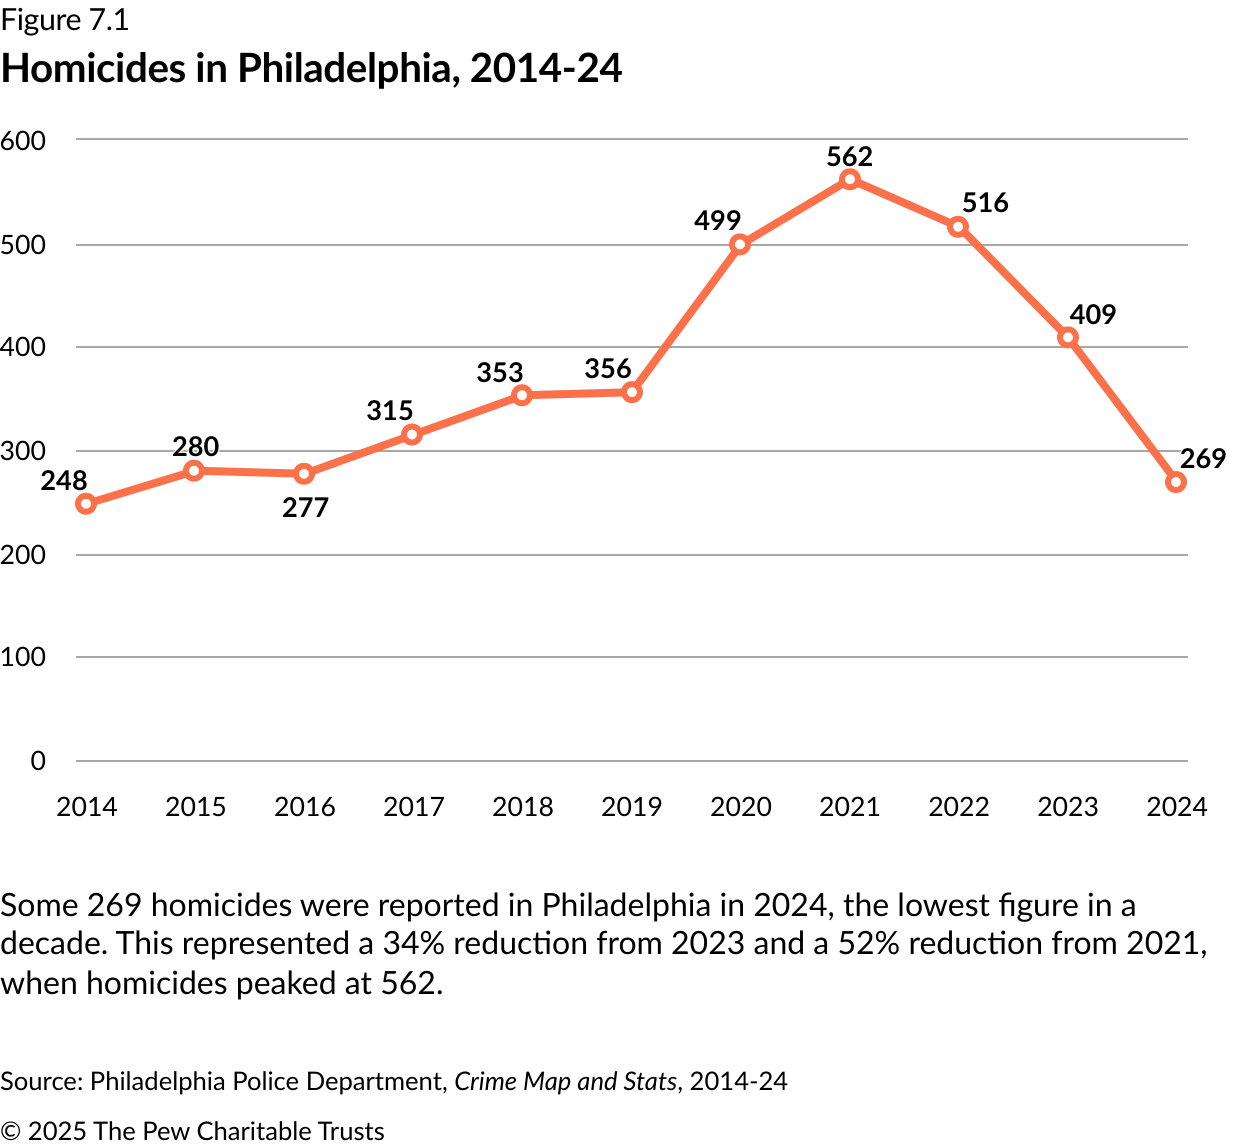
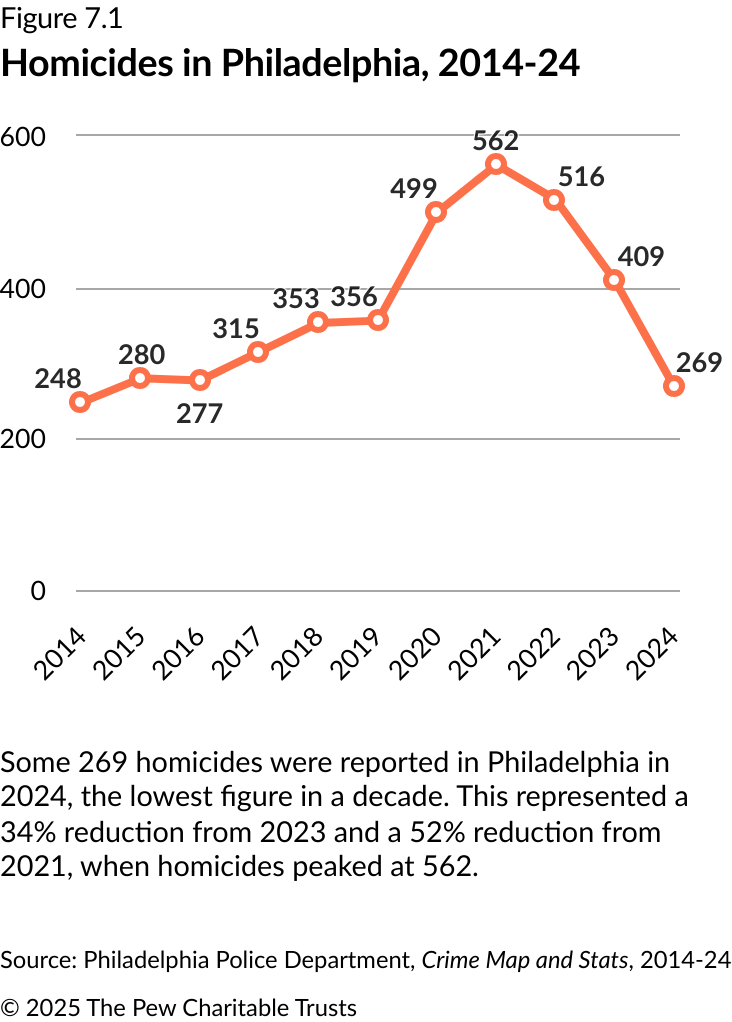
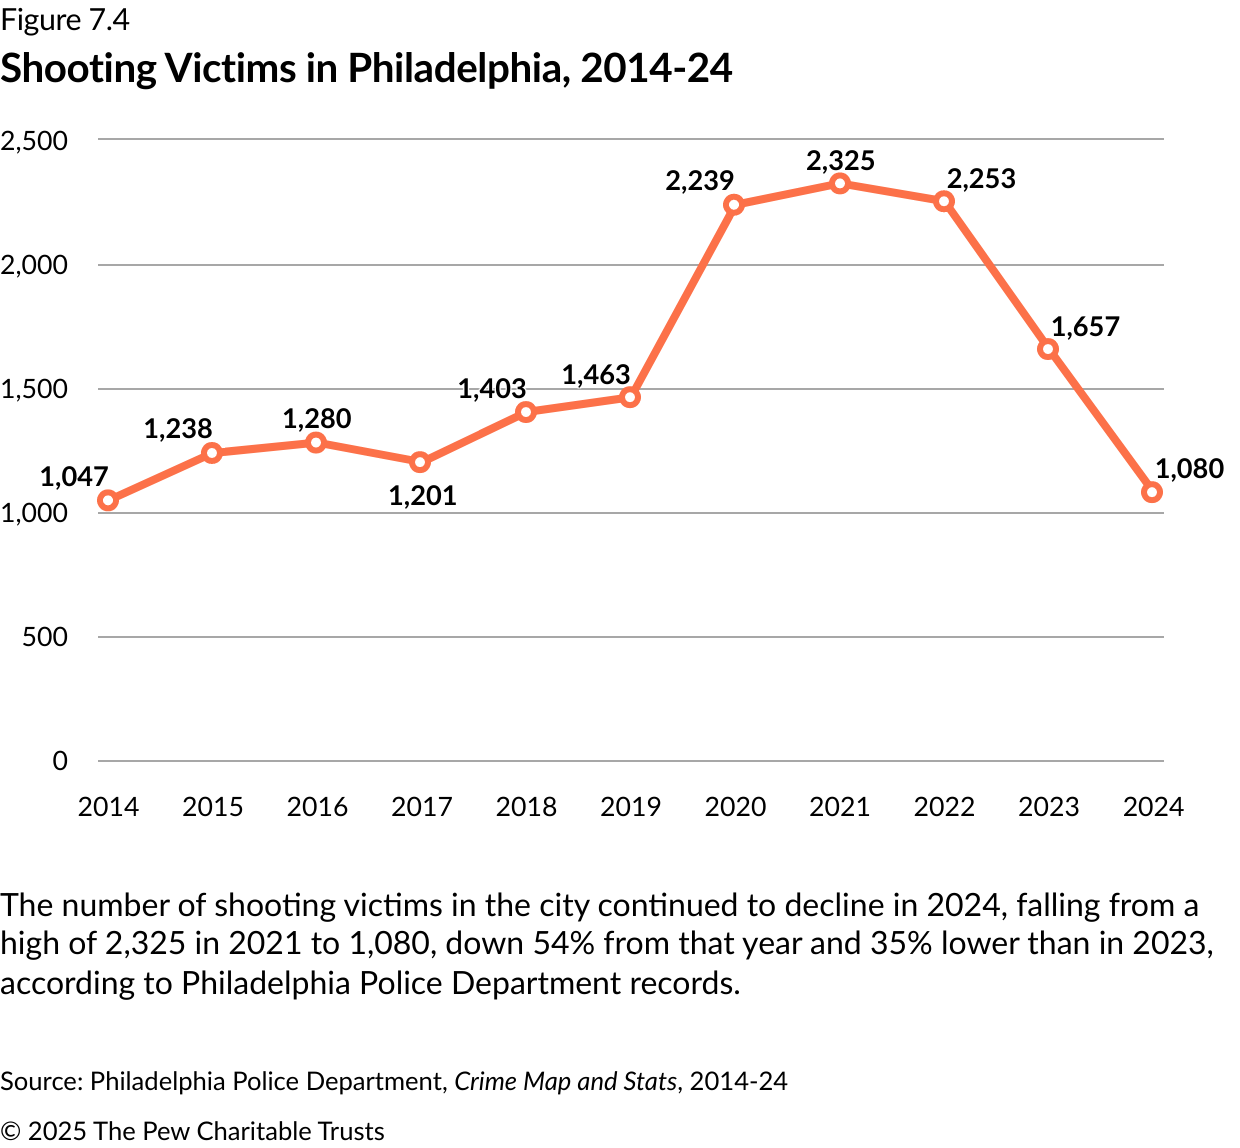
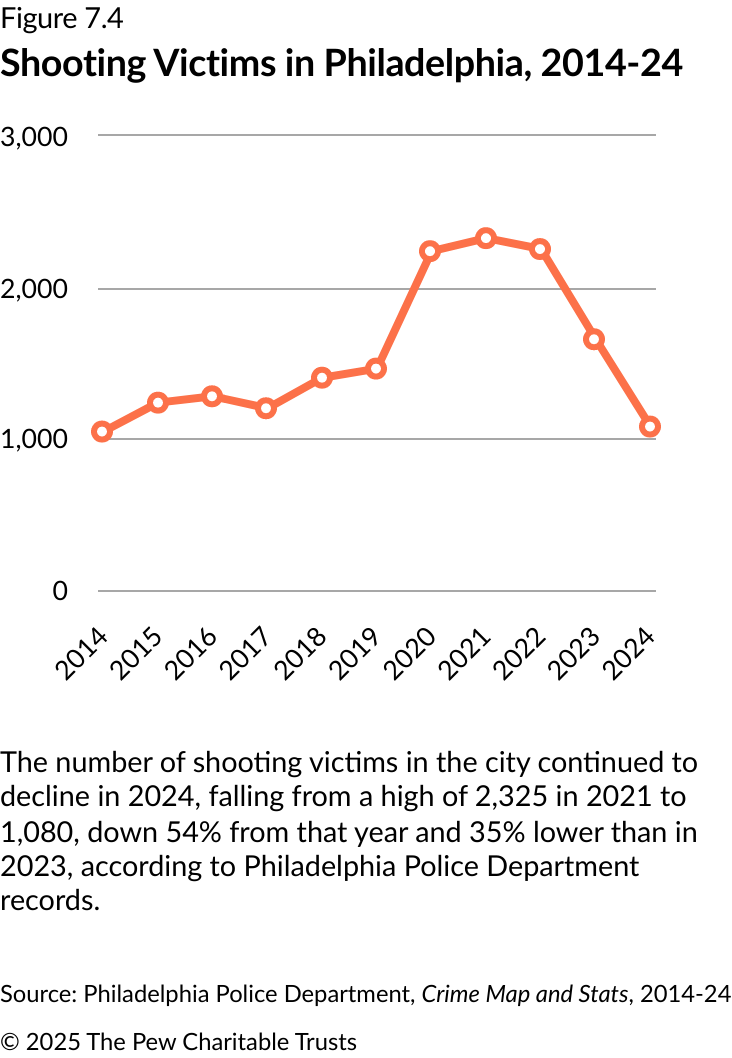
Most dramatically, the number of homicides came in at 269 last year, down 52% from the peak of 562 in 2021. Over the same period, shootings declined by 54%.
Although those numbers dominated the headlines, the overall crime picture was more mixed. Robberies and aggravated assaults committed with a gun declined by 32% in 2024 compared with three years earlier, but there were more aggravated assaults committed without a gun over the same period. And while overall property crime was 10% lower last year than in 2023—with a 33% reduction in the number of stolen cars—overall property crimes were still 35% higher than in 2021.
In this new era in which Philadelphia seems to be on the upswing in many ways, the city still faces many challenges, some of them familiar and others not.
While the poverty rate has dropped, the city still has more than 300,000 people living below the poverty line. More residents experienced homelessness in 2024 than ever before, with a 10% increase from the previous year. The percentage of adults with a college degree declined slightly, after 20 years of steady annual increases.
Philadelphia’s labor force participation rate fell as well, meaning that fewer people ages 18-64 were actively looking for work in 2024 than in the previous year. Remote and hybrid work remained well above pre-pandemic levels, a trend that generally has a negative impact on city tax revenues, the number of workers in business districts, and the operations of SEPTA, the Philadelphia-area transportation system. In fact, the return to ridership slowed in 2024, with SEPTA’s City Transit Division still down 20% compared with 2019. And SEPTA is facing a budget reckoning, albeit delayed because of a late infusion of funds from the state.
Housing affordability also continues to be a struggle for some residents. In addition to the 10% increase in the number of Philadelphians experiencing homelessness, nearly half of renters were cost-burdened, meaning they spent 30% or more of their income on housing. The number of permits issued last year for construction of new housing units (2,962) was the lowest since 2013. And the number of home sales increased to 18,338 in 2024, up 17% from last year. All these trends point to tighter inventory, higher costs for renters, and fewer opportunities for buyers.
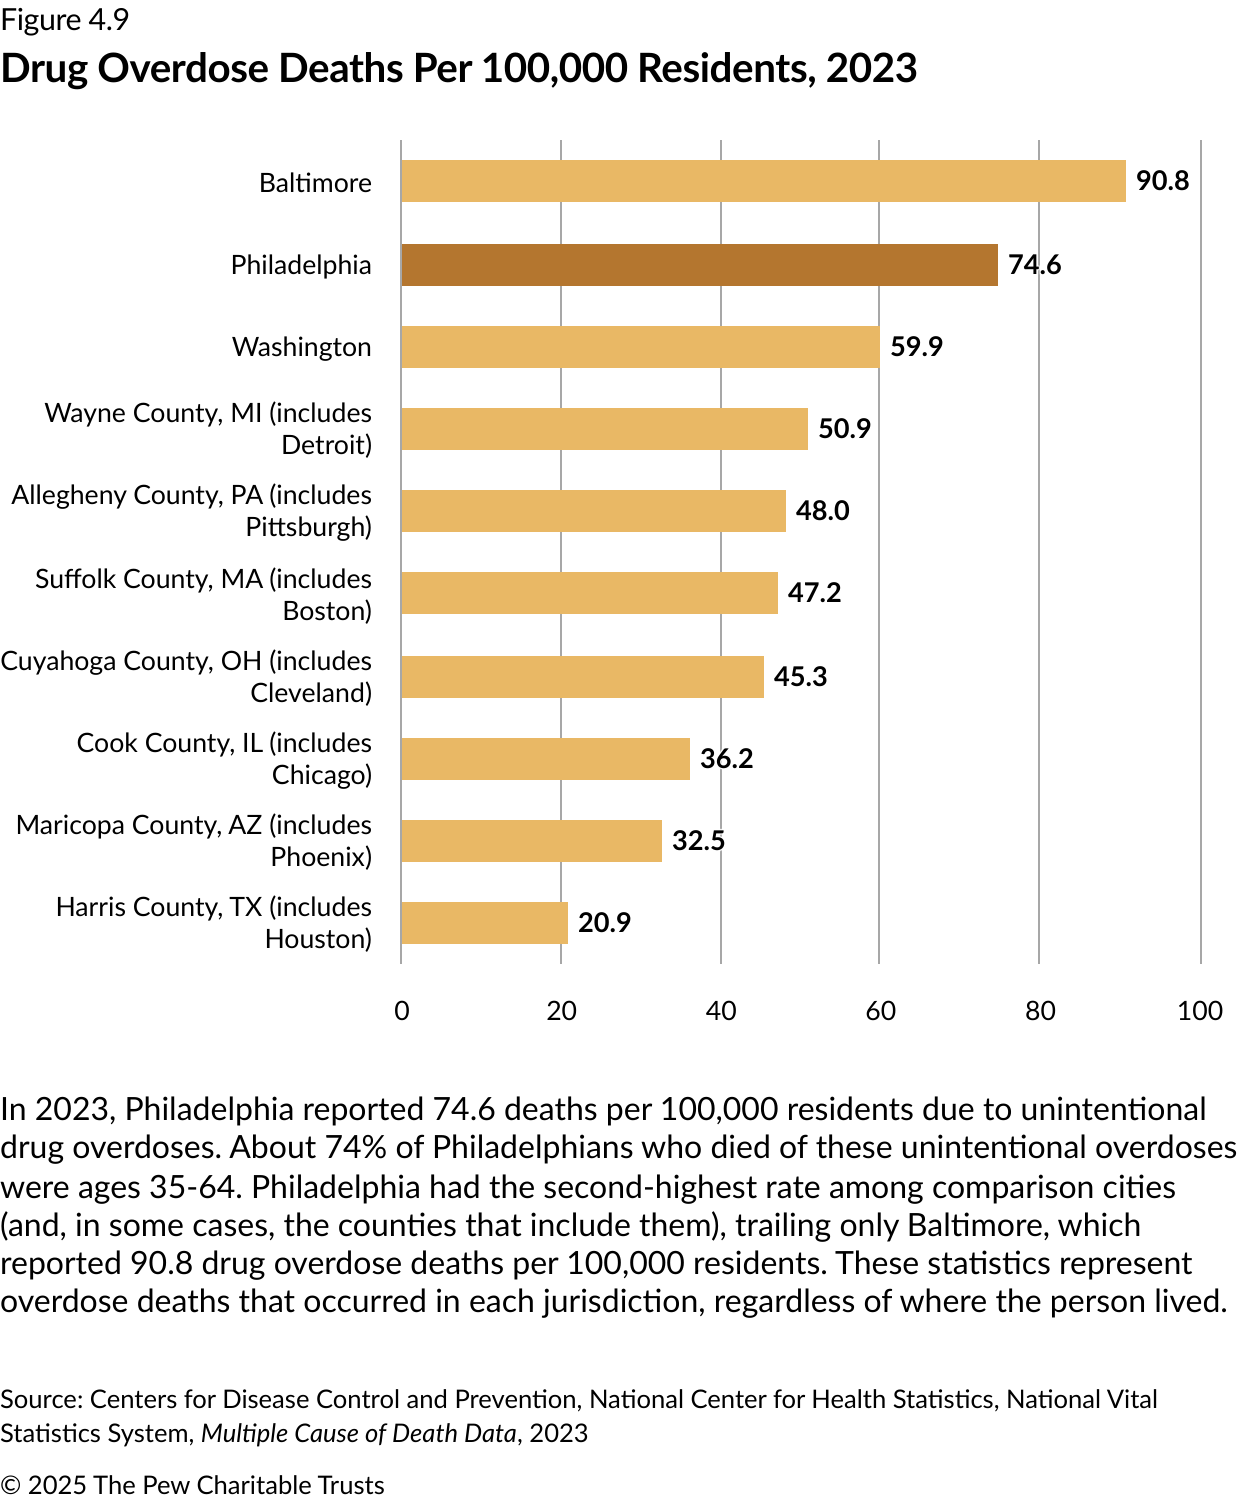
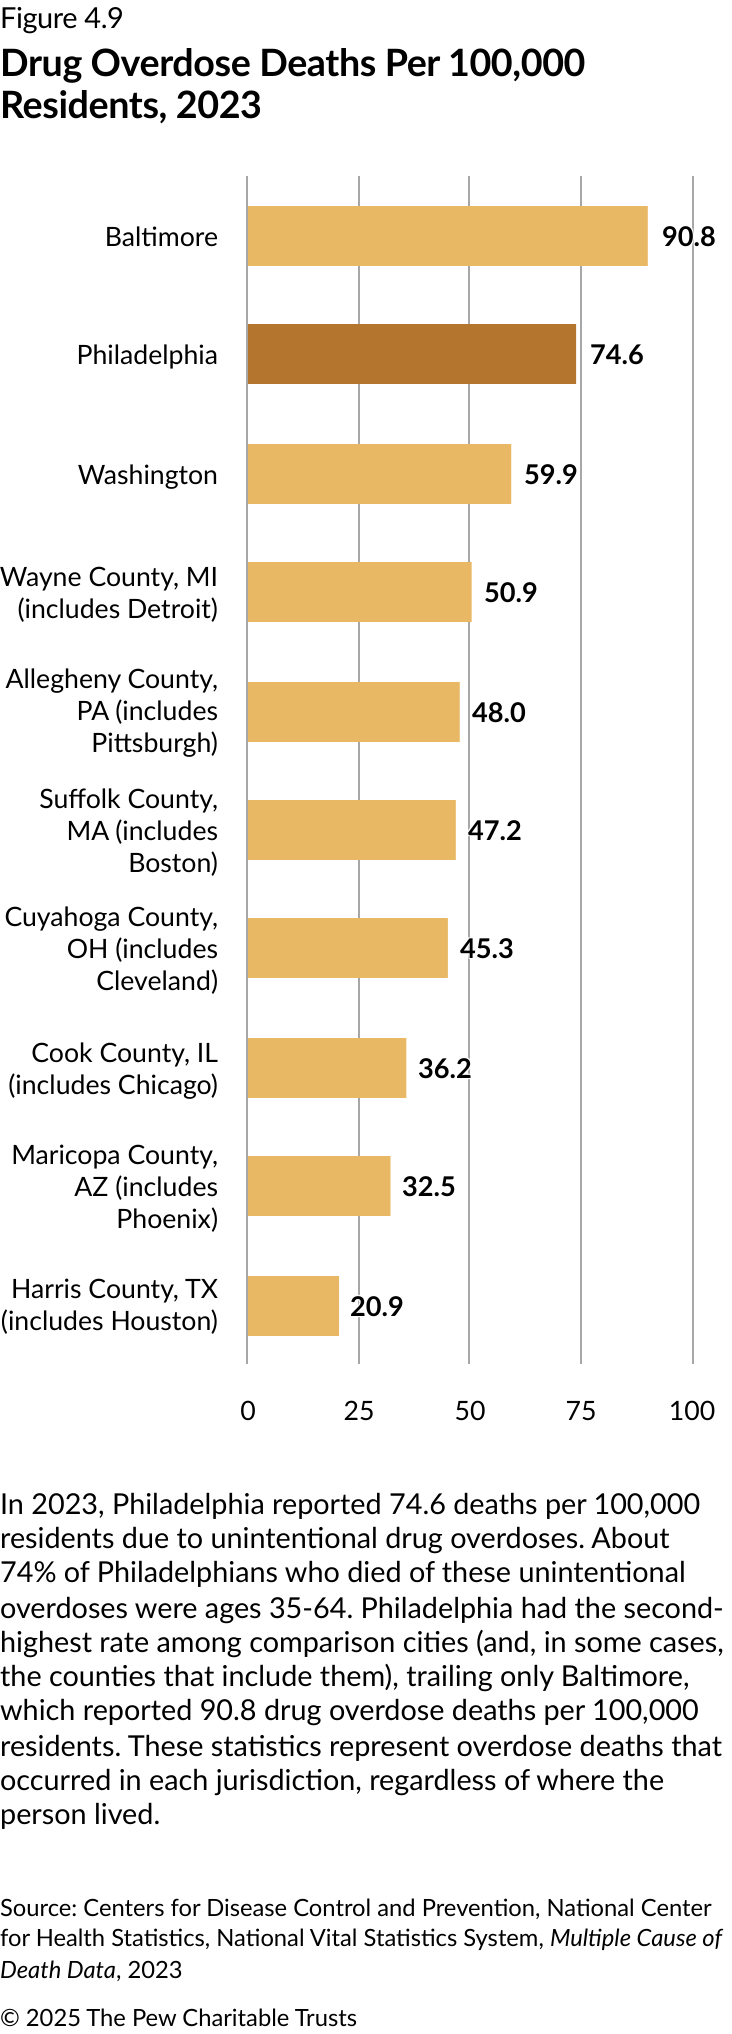
In addition, misuse of opioids and other drugs remains a major problem. Drug overdoses were the city’s third most prevalent cause of death in 2023, behind heart disease and cancer. And approximately 1,100 people died from unintentional drug overdoses in Philadelphia in 2024, according to the city’s Department of Public Health. In January 2025, Mayor Cherelle Parker opened a new long-term recovery treatment center in Philadelphia’s Holmesburg neighborhood to provide nearly 340 beds for patients who can be referred after completing inpatient treatment elsewhere. The city also established a new drug court, located in the Kensington neighborhood, to compel treatment.
Since 2020, when the city’s population briefly surpassed 1.6 million, the number of residents has declined by 1.9%. Much of Philadelphia’s population growth before then came from immigrants, who accounted for 15.1% of residents in 2023, up from 9% in 2000. But with a new administration in the White House, the flow of immigrants into the country is likely to subside, which may make it difficult for the city to maintain its current population and workforce numbers.
In fact, on immigration and many other fronts, a key question for Philadelphia and other cities is how changing federal policies will affect residents, businesses, and local government.
Pandemic-era challenges are fading. But the issues taking their place will test Philadelphia’s leaders and residents in new ways in the years ahead.
Flip to Find Out
Flip to Find Out
TRue or False?
TRue or False?


Philadelphia 2024

Education
It has been over two years since the nearly 200,000 students in Philadelphia’s district and charter schools returned to full-time in-person learning. Despite some uncertainty about the pandemic’s longer-term impact on students, particularly regarding academic achievement, some positive trends have started to emerge.
For the first time since 2014, the School District of Philadelphia’s enrollment numbers increased from the previous year, rising by 1,713, or about 1.5%, for the 2024-25 school year. And according to the most recent data available, the four-year graduation rate rose to 74% for the class of 2023, up from a low of 70% during the pandemic for the class of 2021.
Yet some parts of the education sector had not fully recovered. The percentage of 3- and 4-year-olds attending nursery school and preschool was 41.5% in 2023, down from 49.2% in 2019, before the pandemic.
As for adult residents, nearly 36% of Philadelphians ages 25 and older had bachelor’s degrees in 2023, according to the Census Bureau—roughly the same share as the year before and in line with the national average.
Percentage of Philadelphia Residents Age 25 or Older With a Bachelor’s Degree or Higher, 2023
By ZIP code
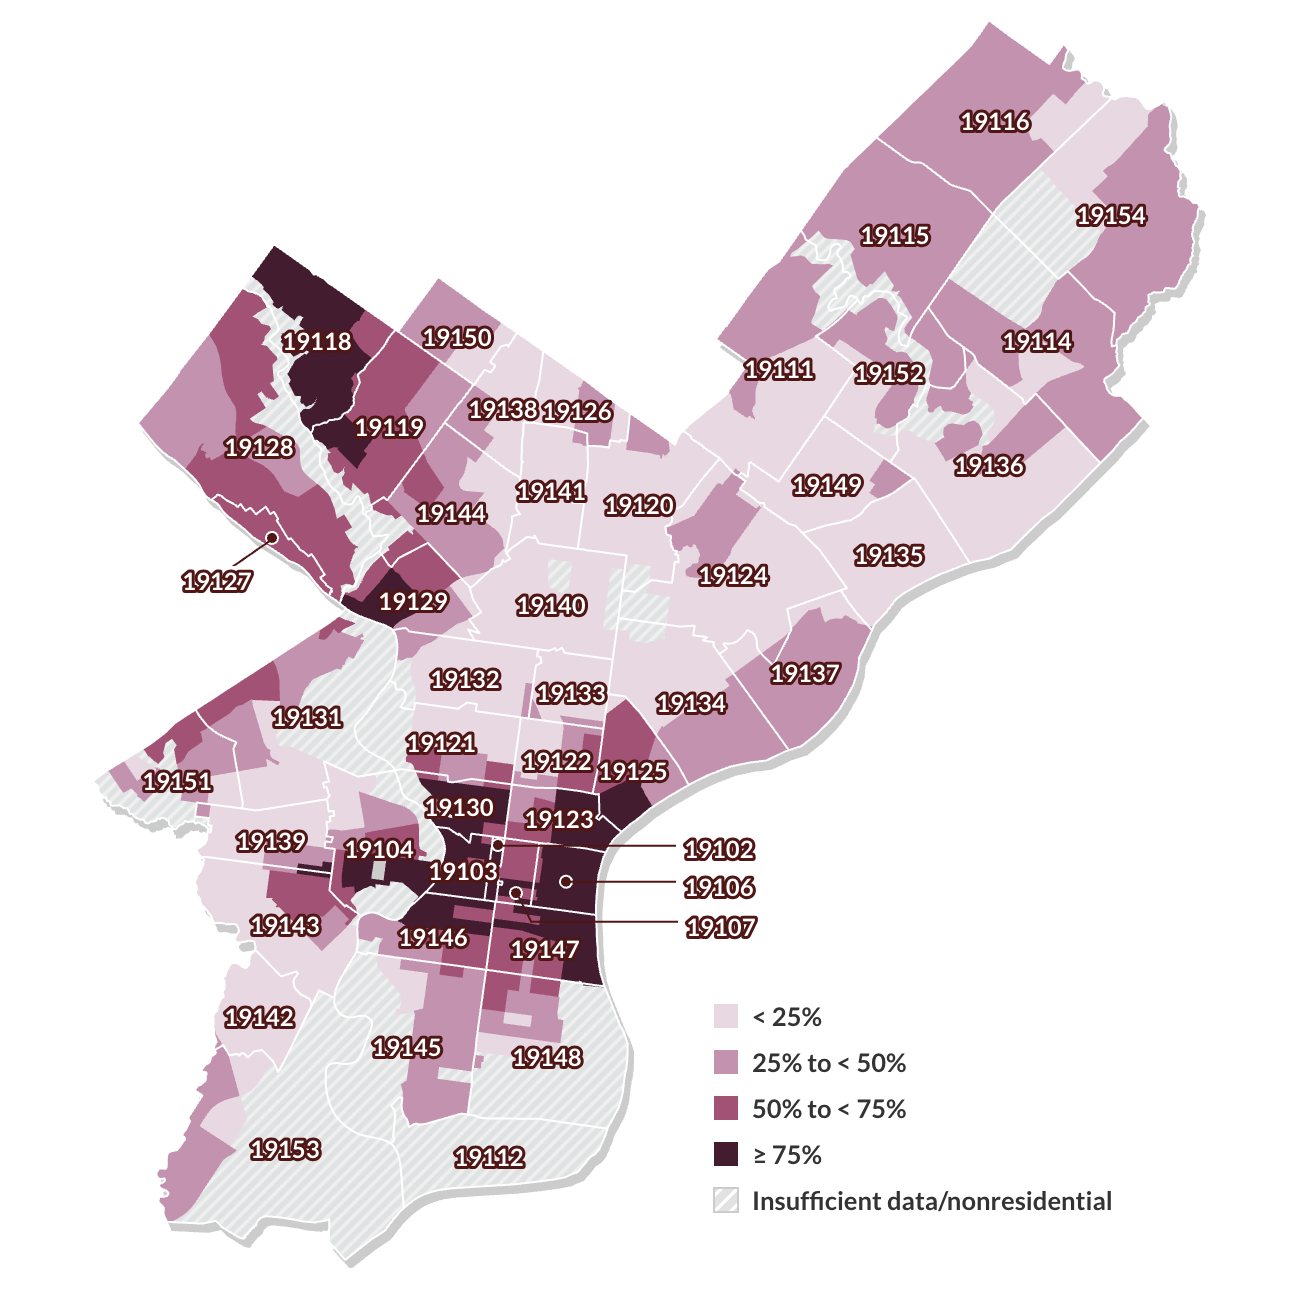
As of 2023, nearly 36% of residents in Philadelphia age 25 or older had a bachelor’s degree or higher, a much larger percentage than a decade earlier. But the level of educational attainment is much higher in some neighborhoods than in others. In some areas of Northwest Philadelphia, Center City, and West Philadelphia, at least 75% of residents age 25 or older have a bachelor’s degree or more education, while in numerous parts of the city, less than 25% of residents do.
Source: U.S. Census Bureau, American Community Survey, five-year estimates, Educational Attainment, Table S1501, 2019-23
© 2025 The Pew Charitable Trusts View image View image
Philadelphians’ Top 5 Occupations, 2023
By educational attainment
| Education | Top occupations |
|---|---|
| Less than high school (Median income: $22,000) |
Janitors and building cleaners Cashiers Food preparation workers Home health aides Construction laborers |
| High school diploma or high school equivalent (Median income: $32,200) |
Cashiers Personal care aides Driver/sales workers and truck drivers Security guards and gaming surveillance officers Laborers and freight, stock, and material movers |
| Some college (Median income: $32,000) |
Cashiers Laborers and freight, stock, and material movers Customer service representatives Driver/sales workers and truck drivers Waiters and waitresses |
| Associate degree (Median income: $42,000) |
Customer service representatives Registered nurses Personal care aides Home health aides Driver/sales workers and truck drivers |
| Bachelor’s degree or higher (Median income: $69,000) |
Managers Postsecondary teachers Registered nurses Lawyers and judges, magistrates, and other judicial workers Elementary and middle school teachers |
This table lists the top five occupations that Philadelphians held in 2023, according to U.S. Census Bureau data, for each of five different levels of educational attainment. Also shown is the median income for each educational cohort. Residents with the lowest levels of education— Philadelphians with less than a high school diploma and high school graduates—had a similar range of occupations, including laborers and cashiers. For those with some college and up to an associate degree, the most common jobs were customer service representatives and driver/ sales workers and truck drivers. For those with a bachelor’s degree or more education, nursing and teaching were common occupations.
Source: Pew analysis of U.S. Census Bureau, American Community Survey, Public Use Microdata Sample (2023 one-year estimates)
Flip to Find Out
Flip to Find Out

Government
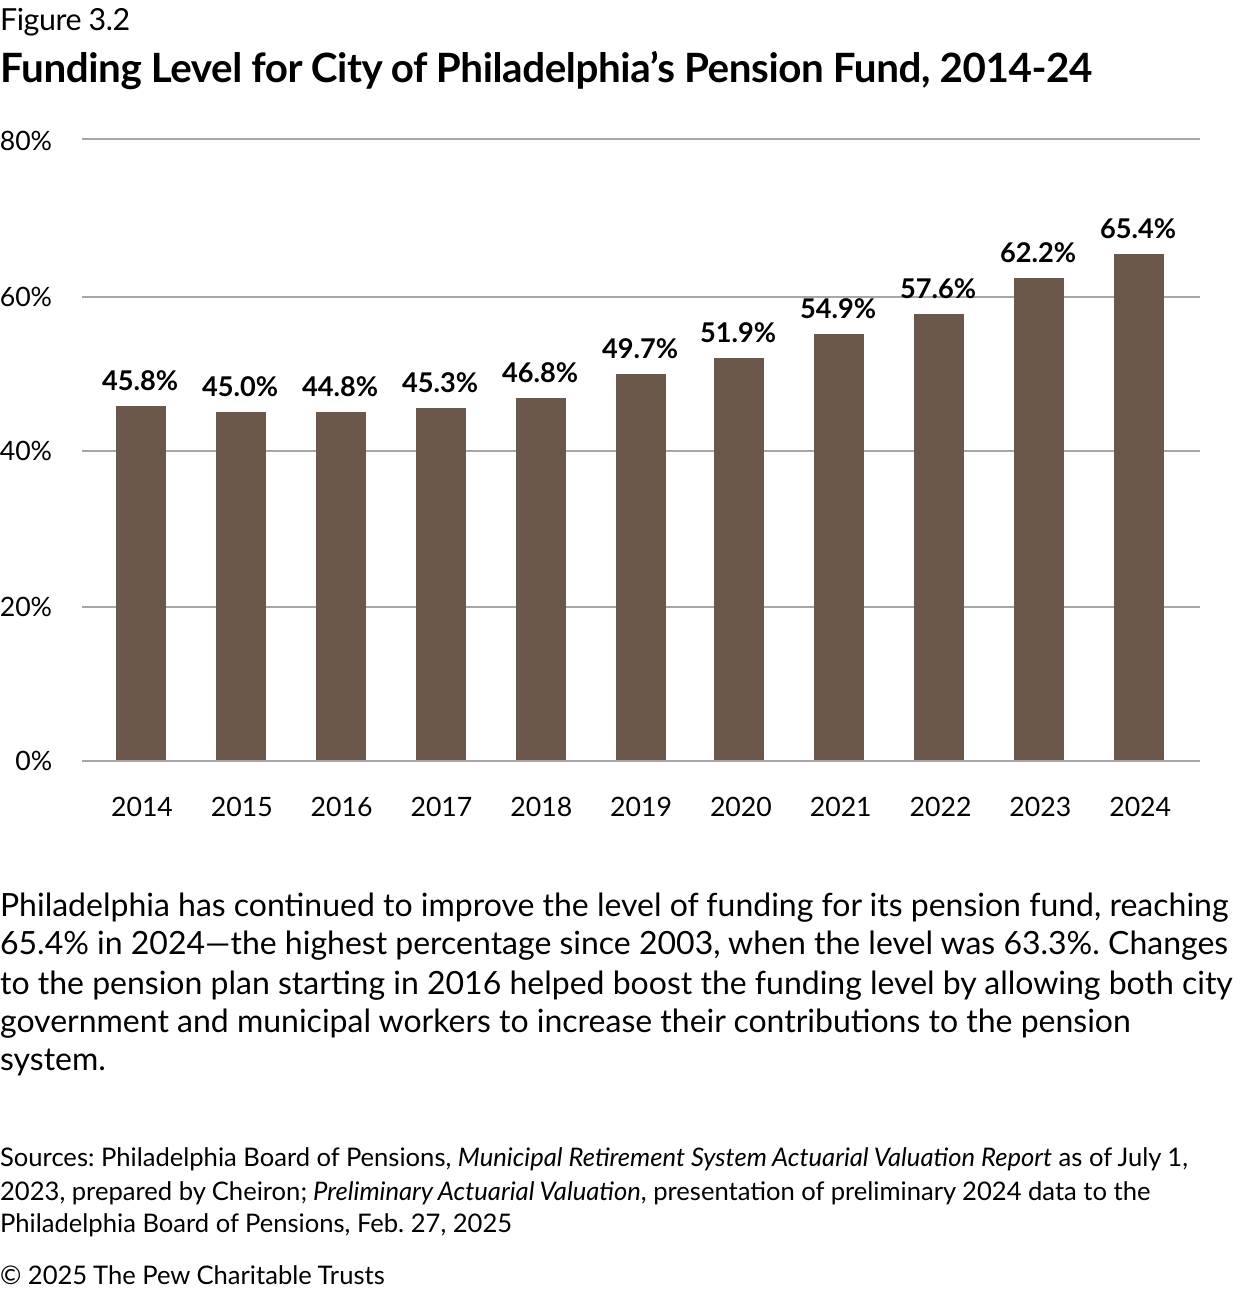
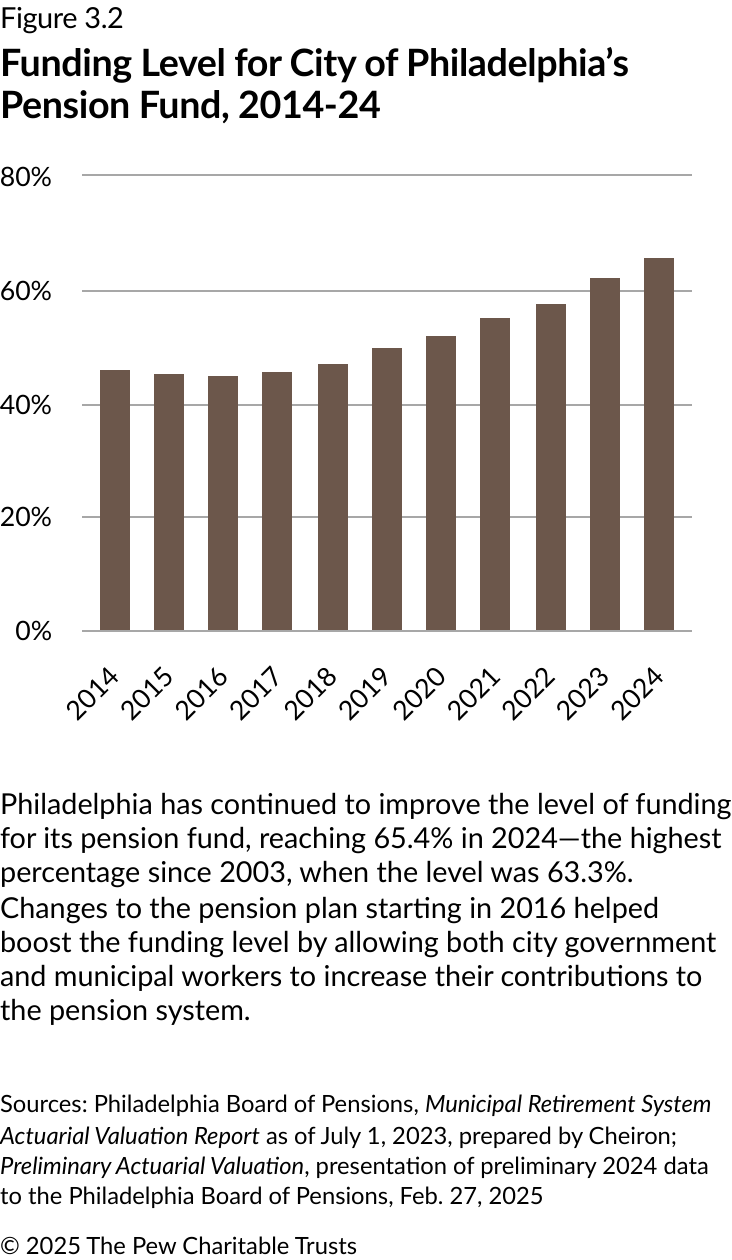
In 2024, the city of Philadelphia received an A+ credit rating from S&P Global Ratings, its highest standing in 40 years, due in large part to the much-improved fiscal status of its municipal pensions. The city reported that its pension funds were 65.4% funded in fiscal 2024, up from 44.8% in 2016 and on track to reach full funding in 2033, which would allow the city to spend more on other priorities. The city’s higher credit rating will also help lower borrowing costs in the future.
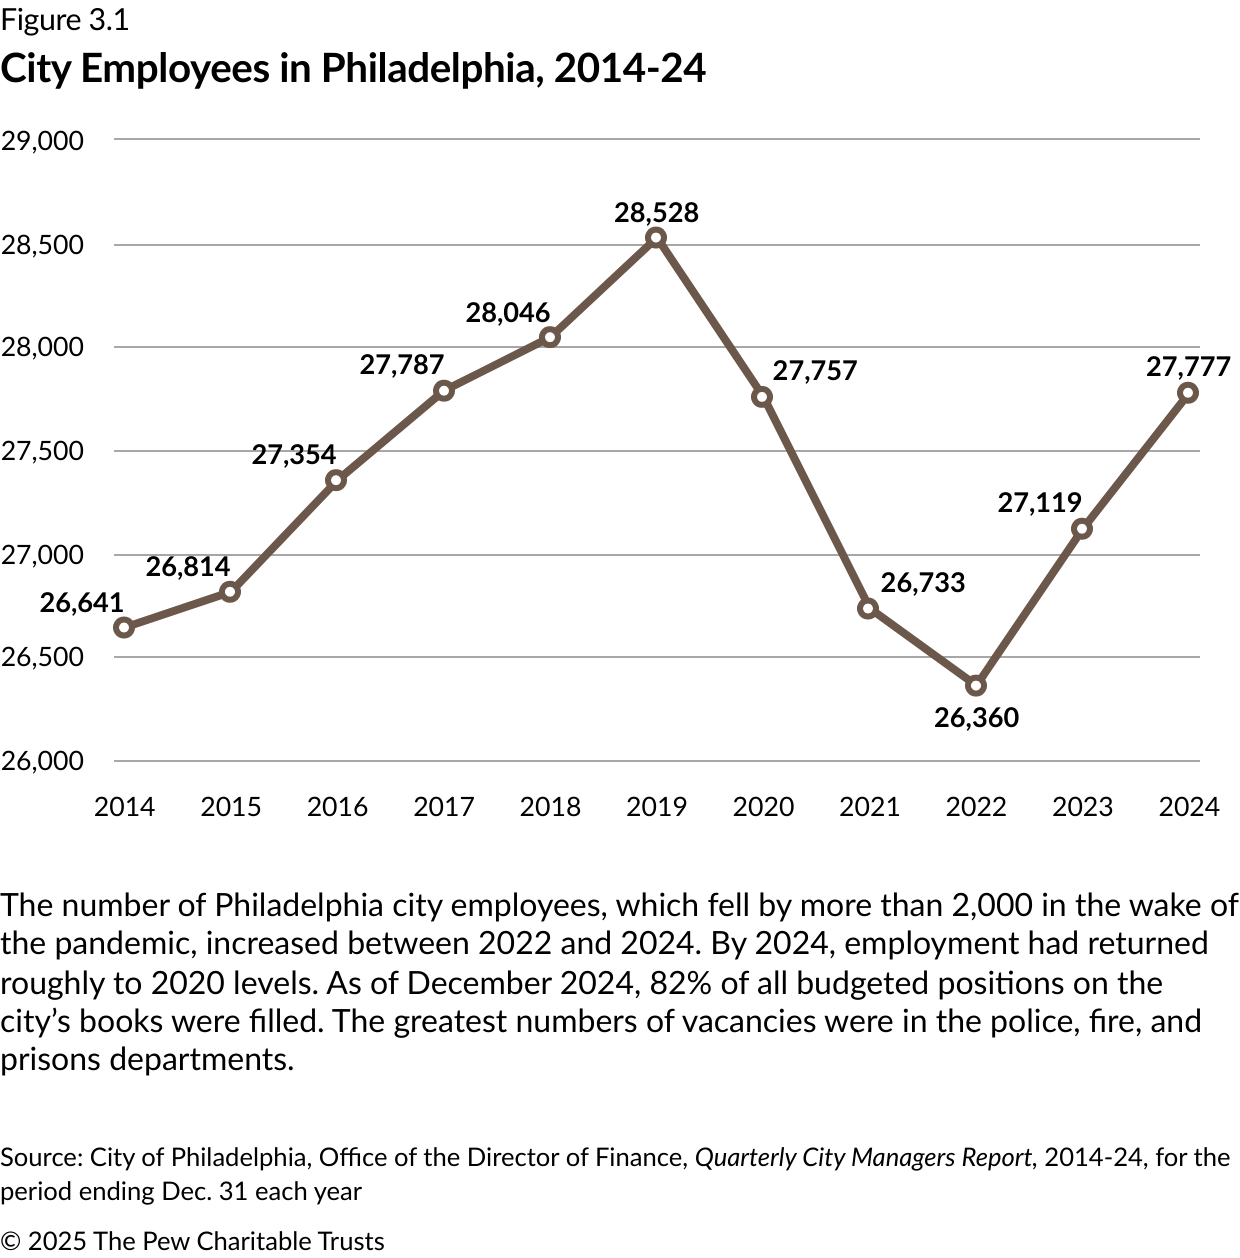
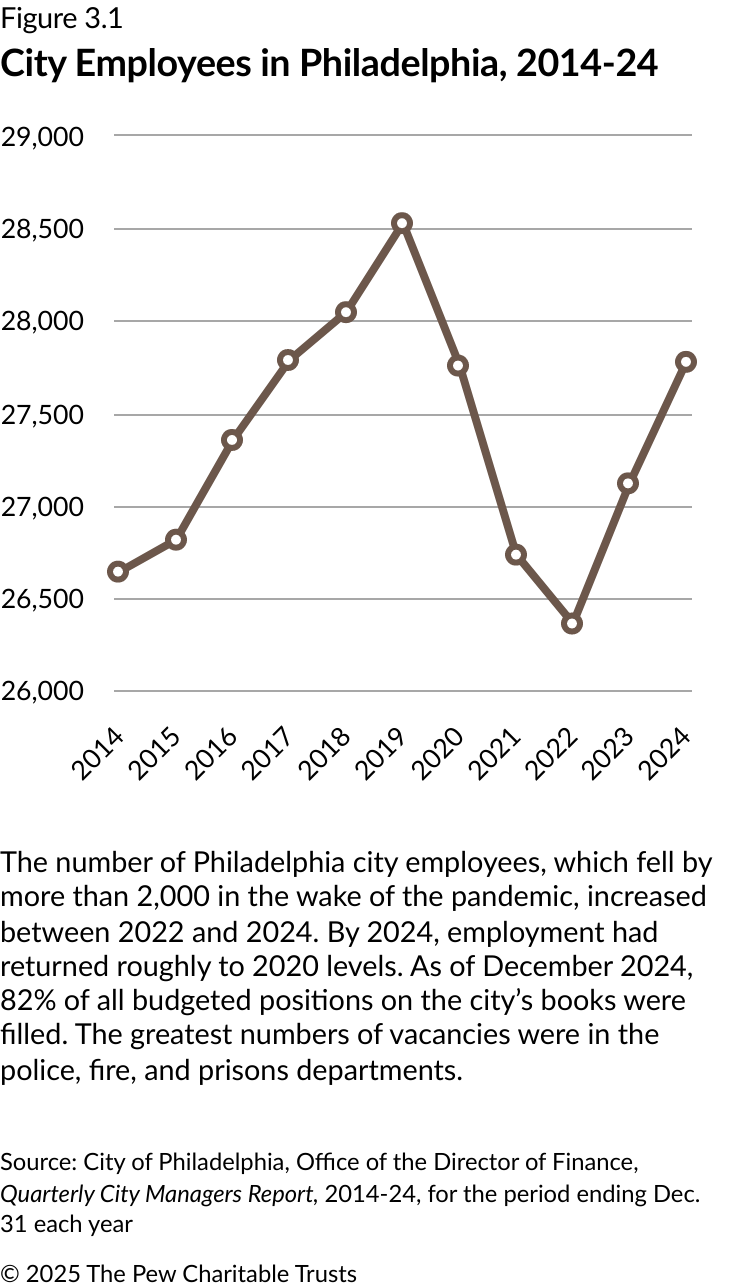
City employment rose to 27,777 employees in 2024, up by 5% from 2022. The job vacancy rate was 18%. And overtime costs kept rising, accounting for 12.9% of all wage and salary expenditures in 2024.
Philadelphia Voter Turnout, 2024 Election
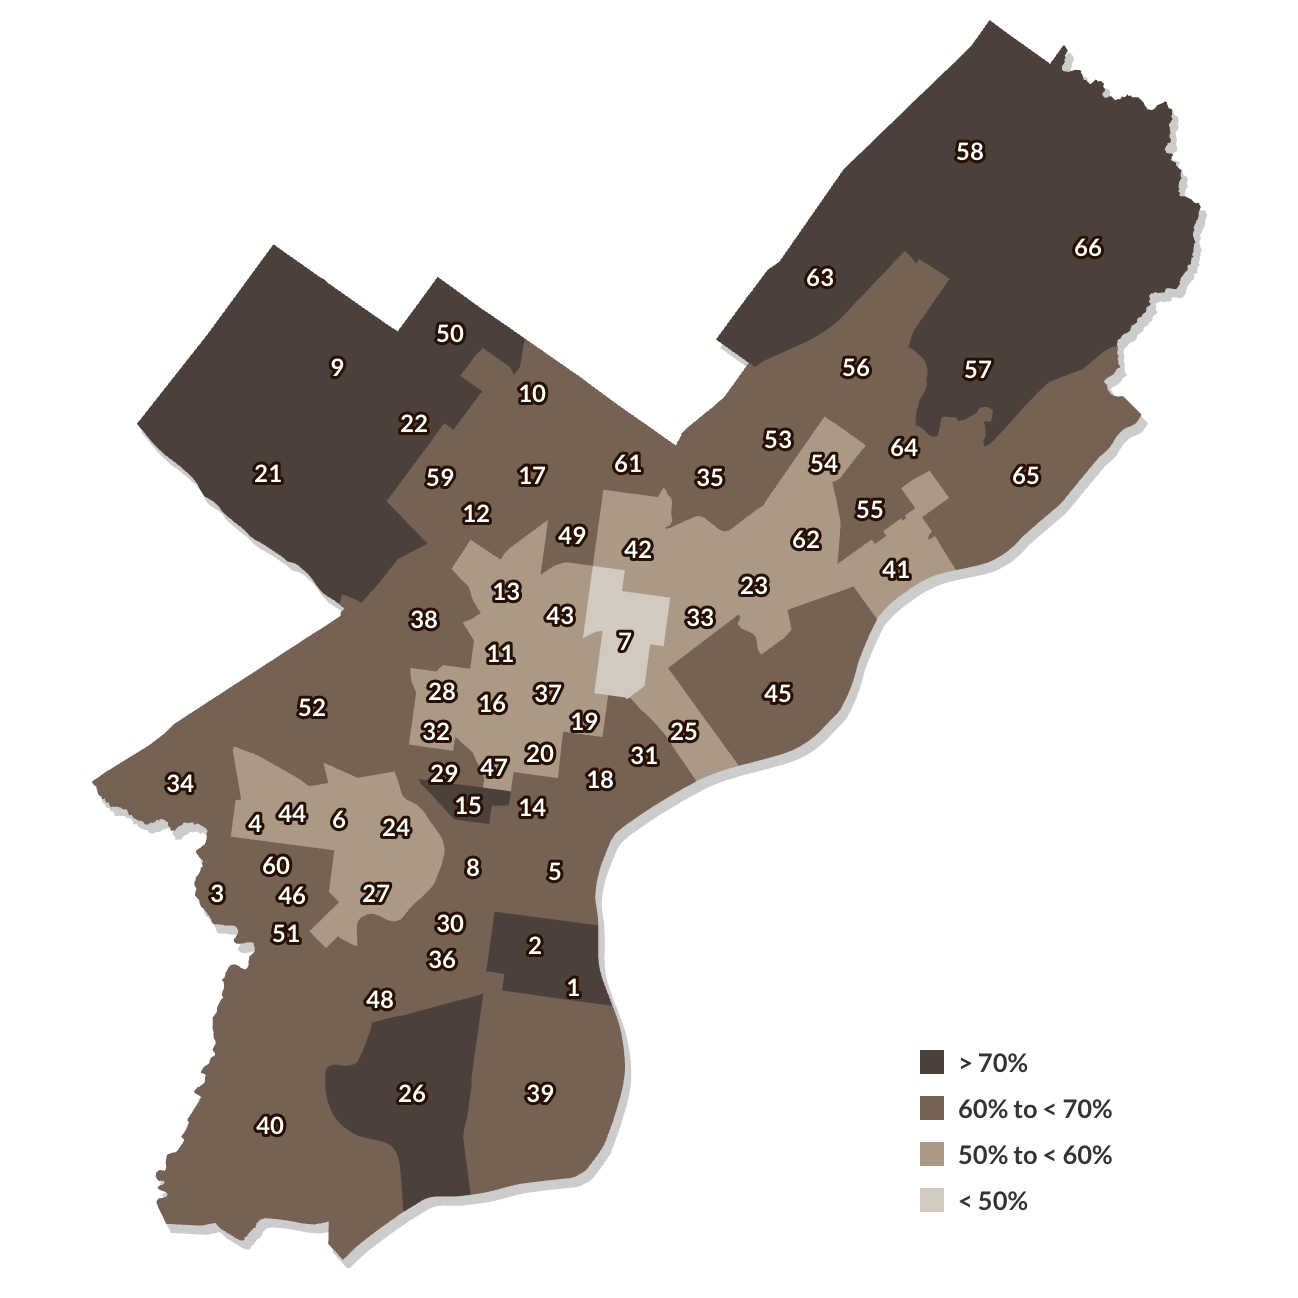
About 65% of Philadelphia’s roughly 1.1 million registered voters participated in the 2024 general election, in which Pennsylvanians voted for president; a U.S. senator; and members of the House of Representatives, the Pennsylvania General Assembly, and three state row offices (attorney general, auditor general, and treasurer). Of the 727,595 votes, 528,845 (73%) were cast at polling places and 198,390 (27%) by mail. This map shows the overall turnout percentages in each of the city’s 66 political wards. The 9th Ward, in Chestnut Hill, had the highest turnout, at about 81%; it had also had the highest turnout in the 2020 election. The 7th Ward, in North Philadelphia, had the lowest turnout, at about 46%.
Source: Philadelphia City Commissioners, Unofficial 2024 General Election Results, Nov. 5, 2024
© 2025 The Pew Charitable Trusts View image View image
Flip to Find Out
Flip to Find Out


Health
Drug use and overdoses continue to have a large impact on Philadelphians’ health. In 2024, an estimated 1,100 unintentional overdose deaths occurred in Philadelphia. And among comparison cities, Philadelphia had the second-highest unintentional overdose death rate, according to the most recent data.
Other health-related data showed that Philadelphians’ life expectancy is up to 76 years, nearly back to pre-pandemic levels. Roughly 7% of Philadelphians do not have health insurance—lower than the national average. And the number of residents enrolled in Medicaid decreased by about 8% in 2024, continuing to decline since pandemic-era enrollment waivers expired in April 2023.
True or False?
True or False?


Housing
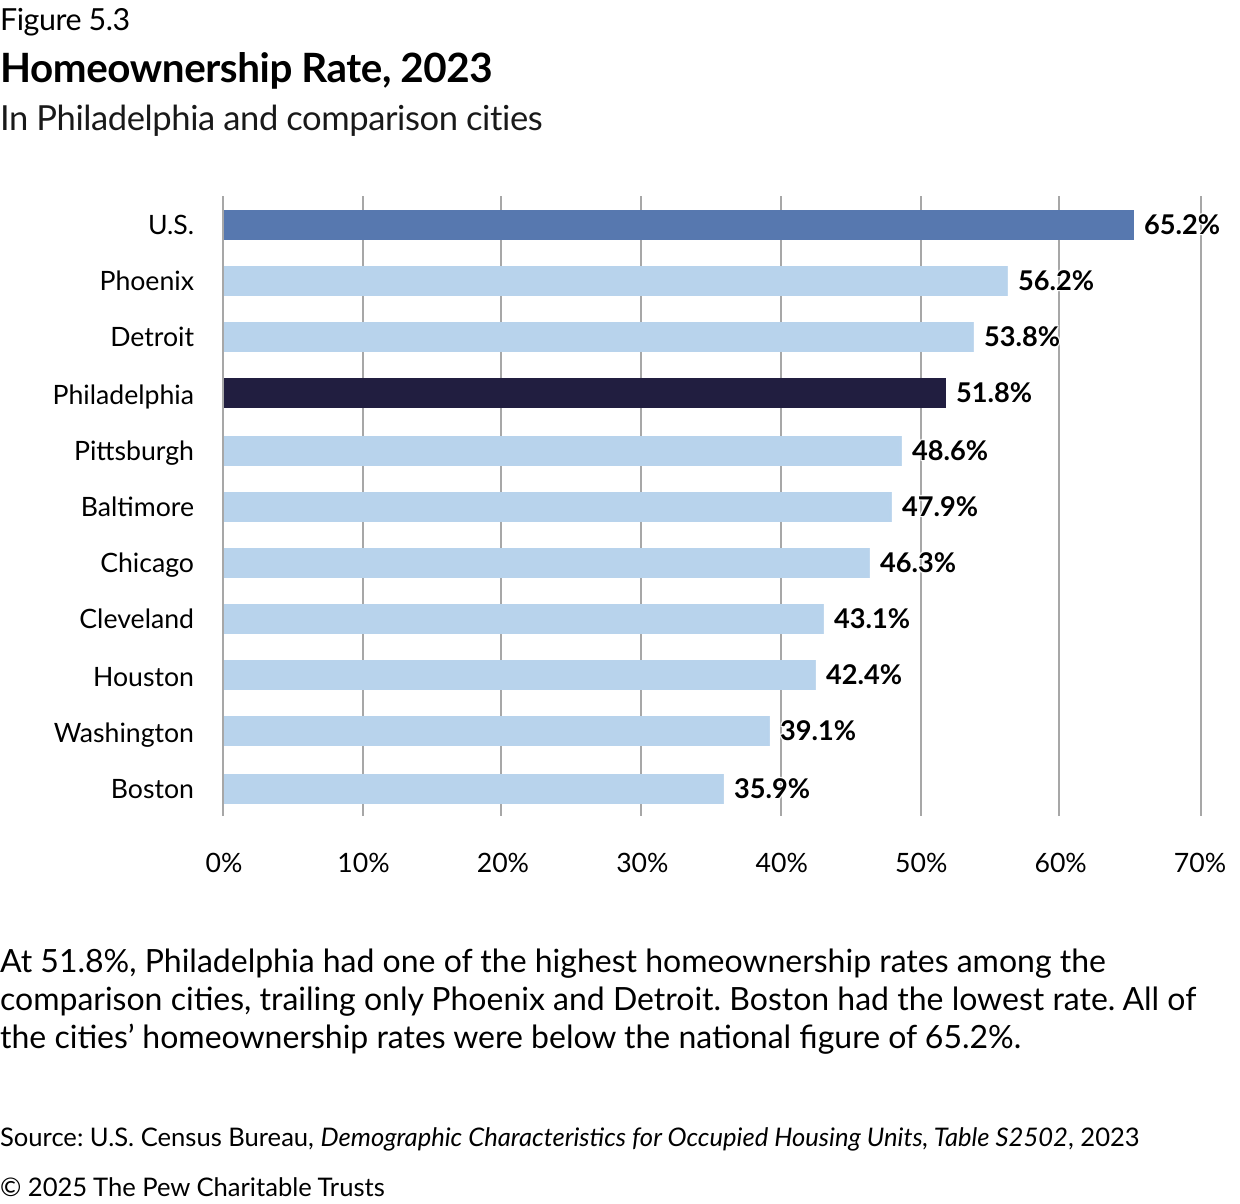
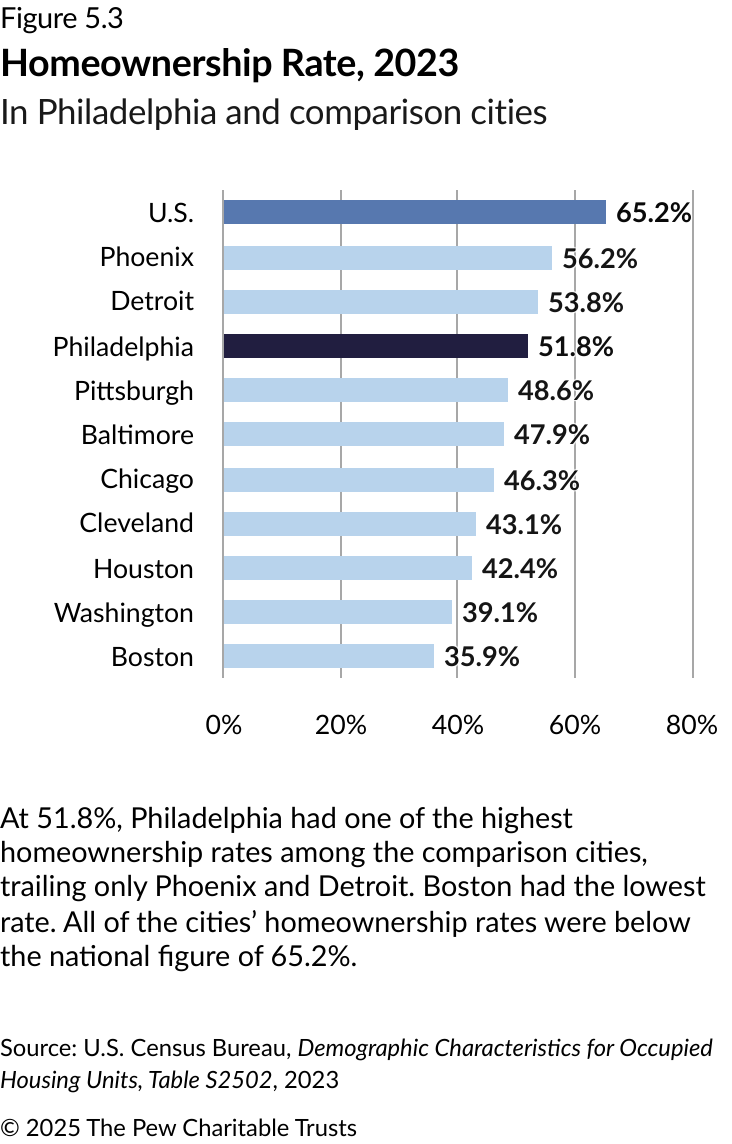
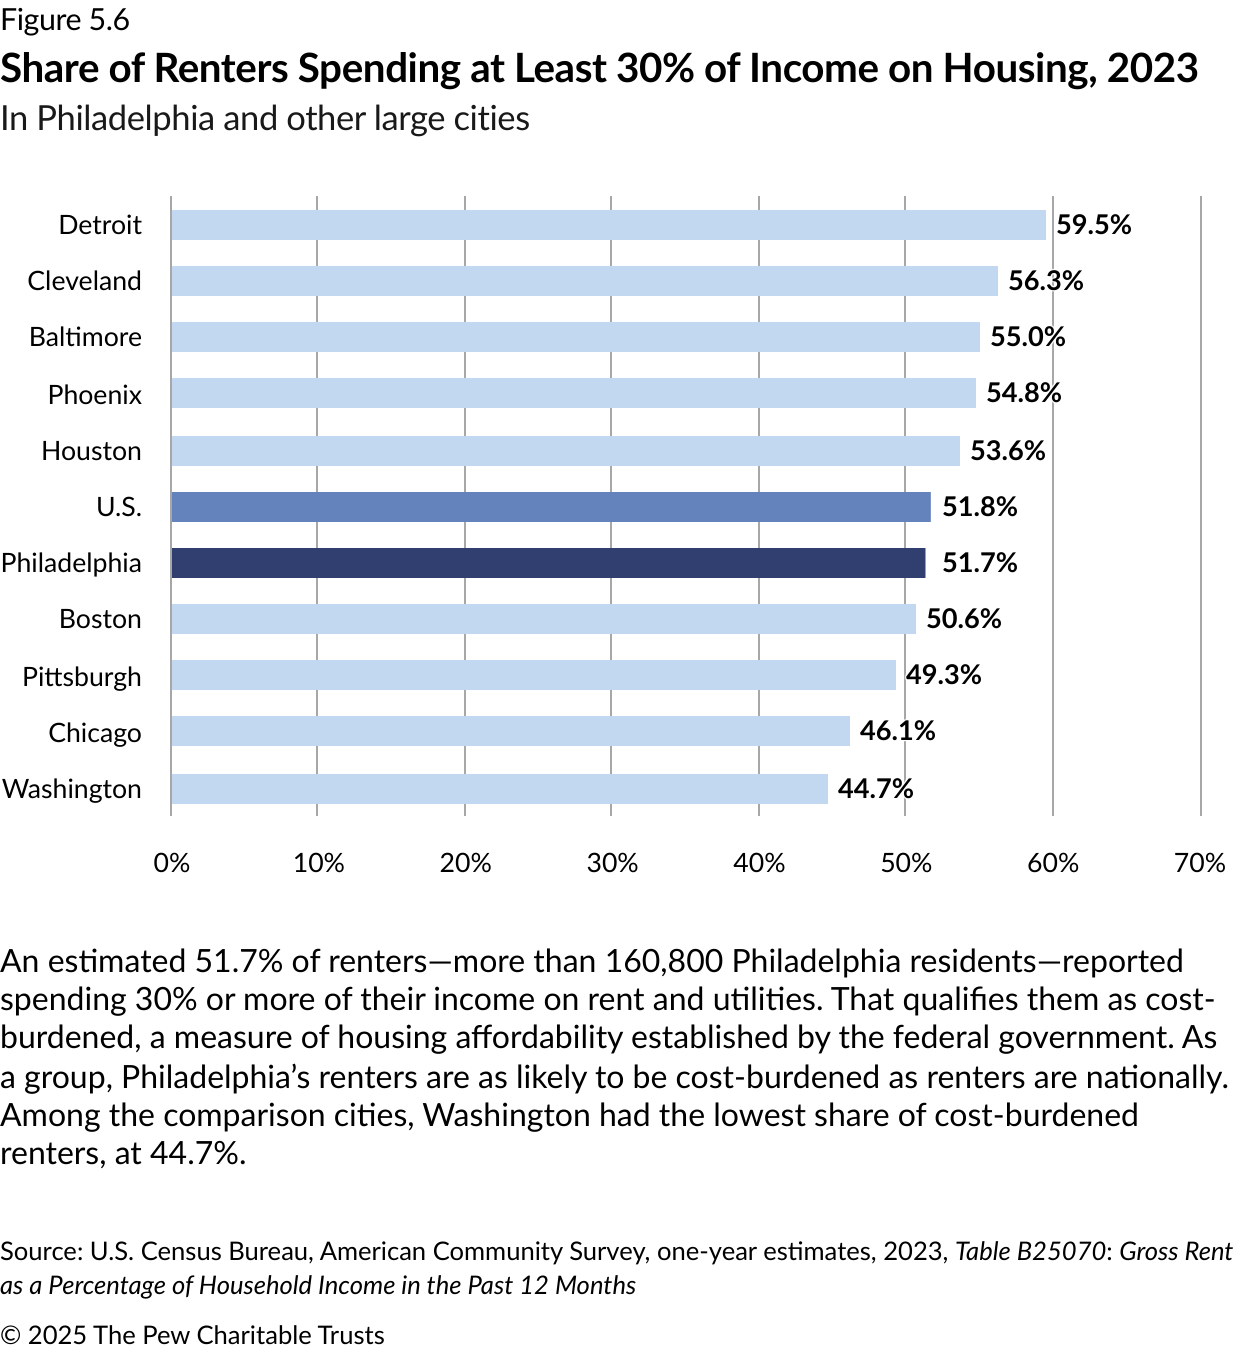
Philadelphia has a relatively high homeownership rate, with more than half of all households living in homes that they own. The city’s homeownership rate in 2023 was 51.8%, the third highest among the nine comparison cities, behind Phoenix and Detroit.
The overall housing market in Philadelphia was mixed. Home sales in the city increased by 17% last year, and median home prices rose to $240,625, more than $15,000 higher than in 2022. Additionally, the total number of residential units for which the city issued building permits was the lowest since 2013.
Meanwhile, the percentage of renters in the city decreased marginally in 2023, after rising for nearly a decade. Affordability continues to be an issue for renters: More than half are paying 30% or more of their income on rent and utilities, similar to the national average of 51.8%. In 2023, the median rent for a two-bedroom apartment in Philadelphia was $1,475, the fourth highest among comparison cities.

Vacant Land or Buildings in Philadelphia, 2025
By census tract
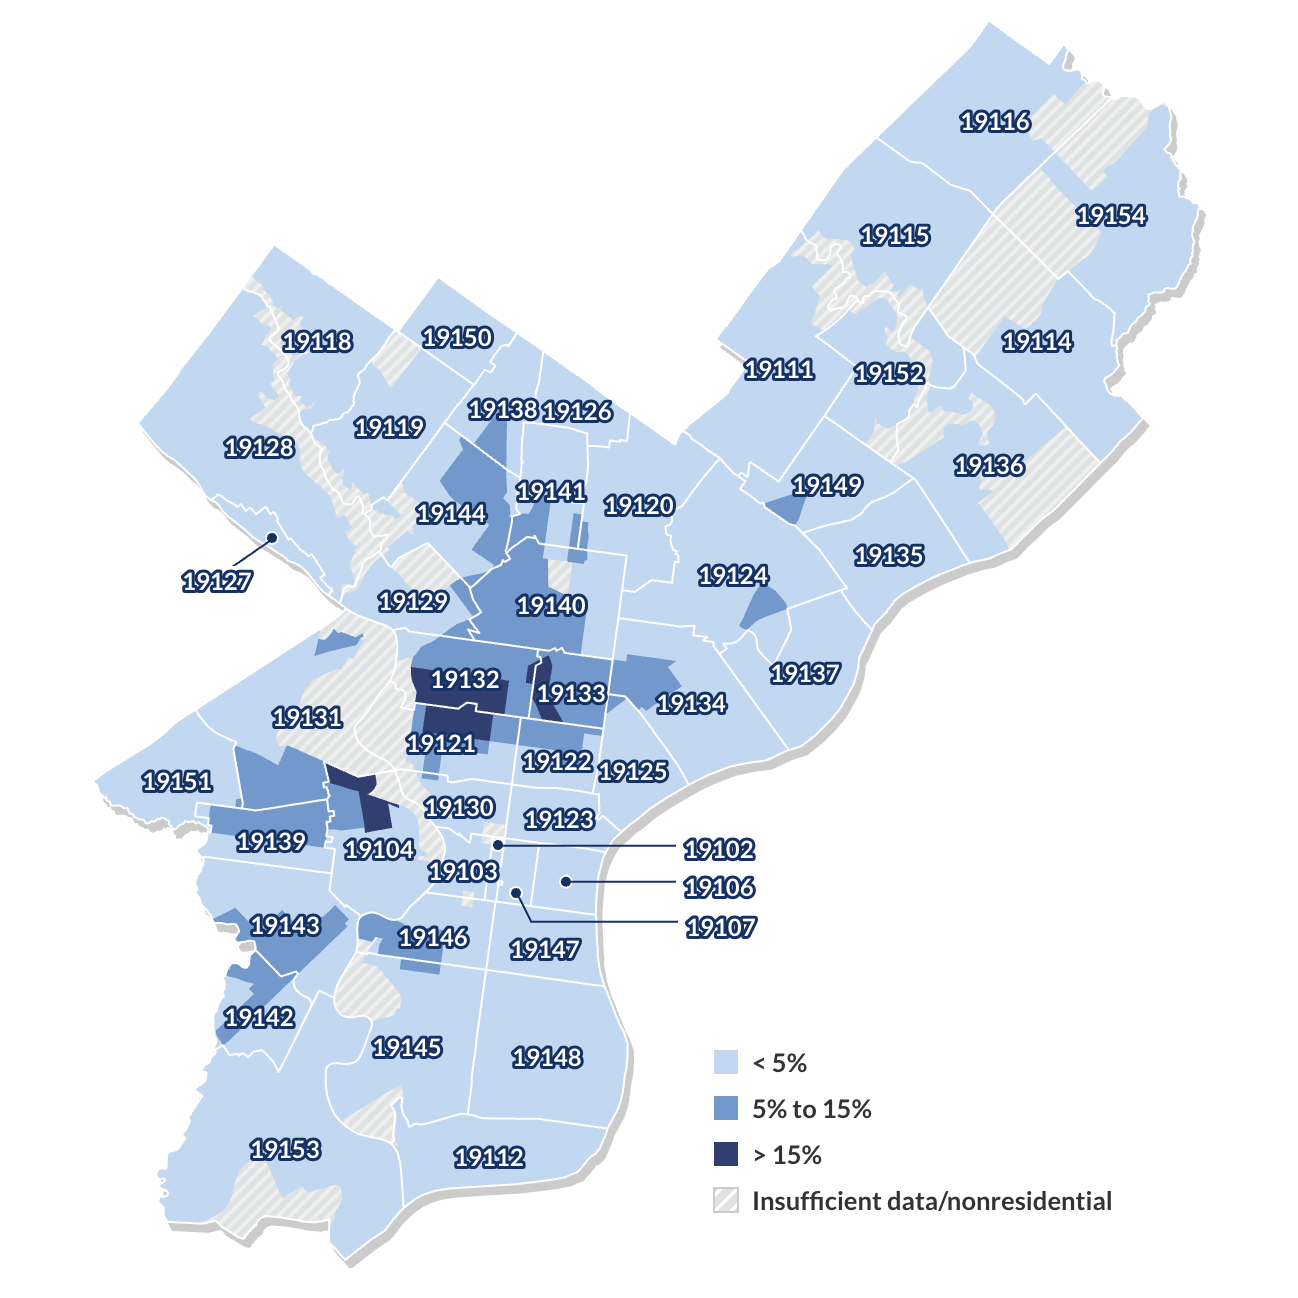
At the start of 2025, there were roughly 21,000 vacant properties in Philadelphia, representing about 3.5% of all parcels, a 1.5 percentage-point decrease from January 2024. Although there was at least some vacant property in every ZIP code in Philadelphia, areas in North Philadelphia (including 19121, 19132, and 19133) as well as areas in West Philadelphia (19104) had a high share of vacancy and the highest share of the city’s vacant properties.
Note: The city of Philadelphia created an aggregated vacancy indicator by combining information from the Department of Licenses and Inspections, Office of Property Assessment, Philadelphia Land Bank, and Philadelphia Water Department. The indicator models land and building vacancy status by 20 different indicators. Parcels that meet at least eight of these criteria are considered vacant.
Source: City of Philadelphia, OpenDataPhilly, Vacant Property Indicators, 2025
© 2025 The Pew Charitable Trusts View image View image


Jobs and the Economy
Philadelphia’s economy kept growing in 2024, although not as robustly as in the year before.
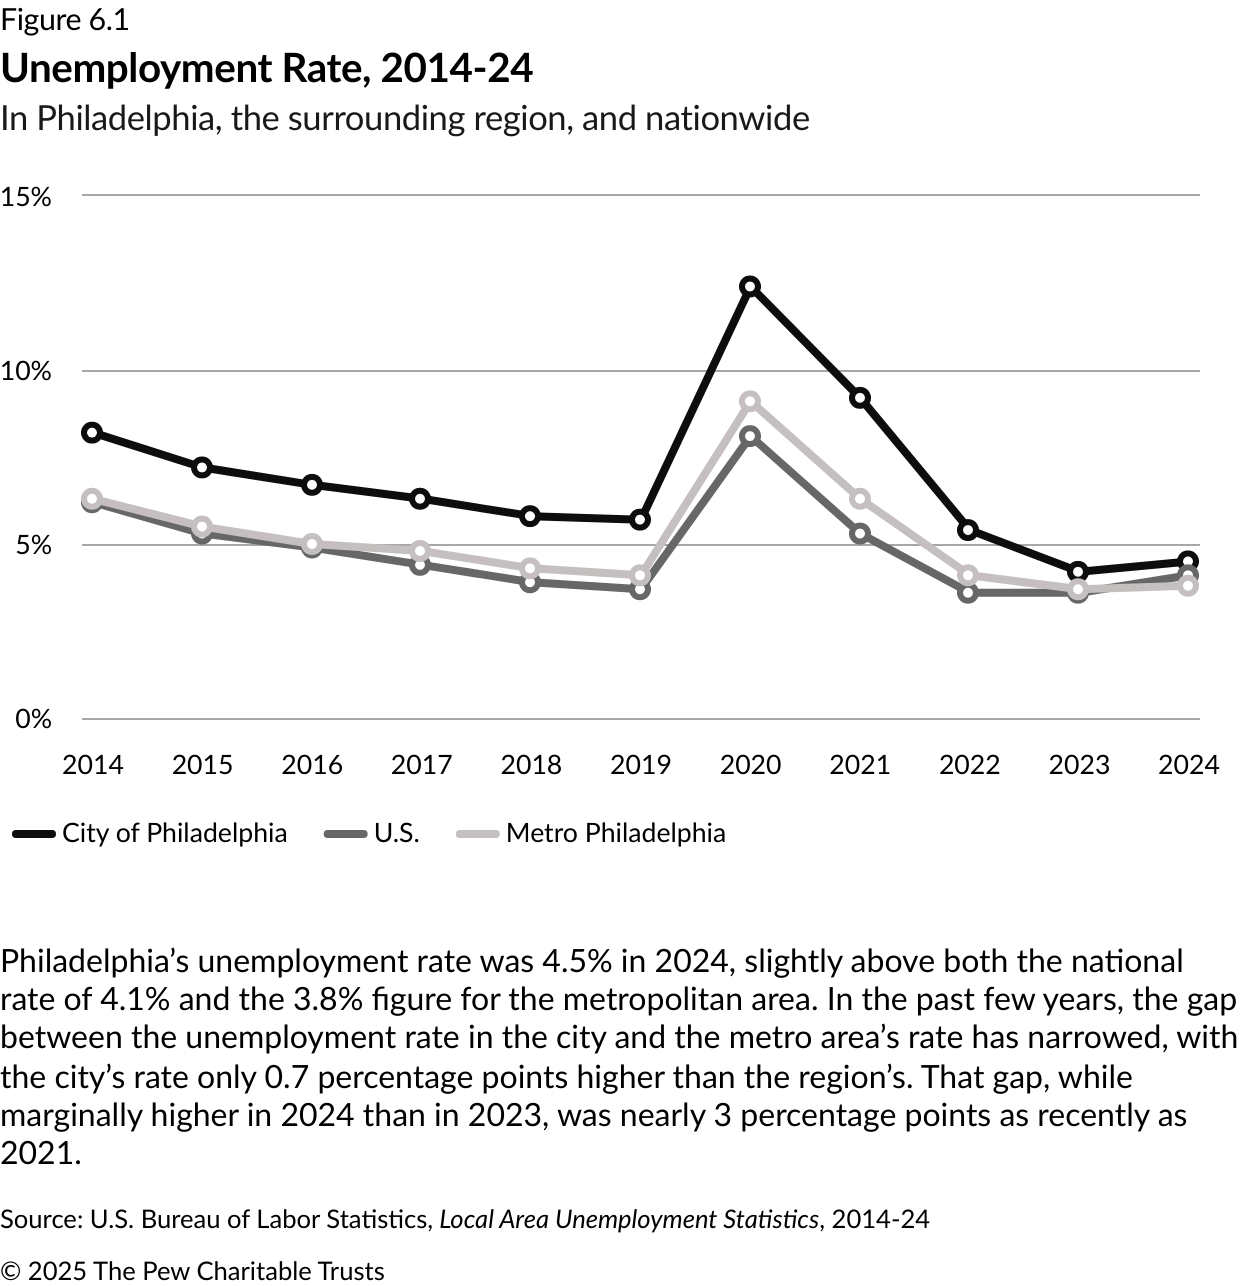
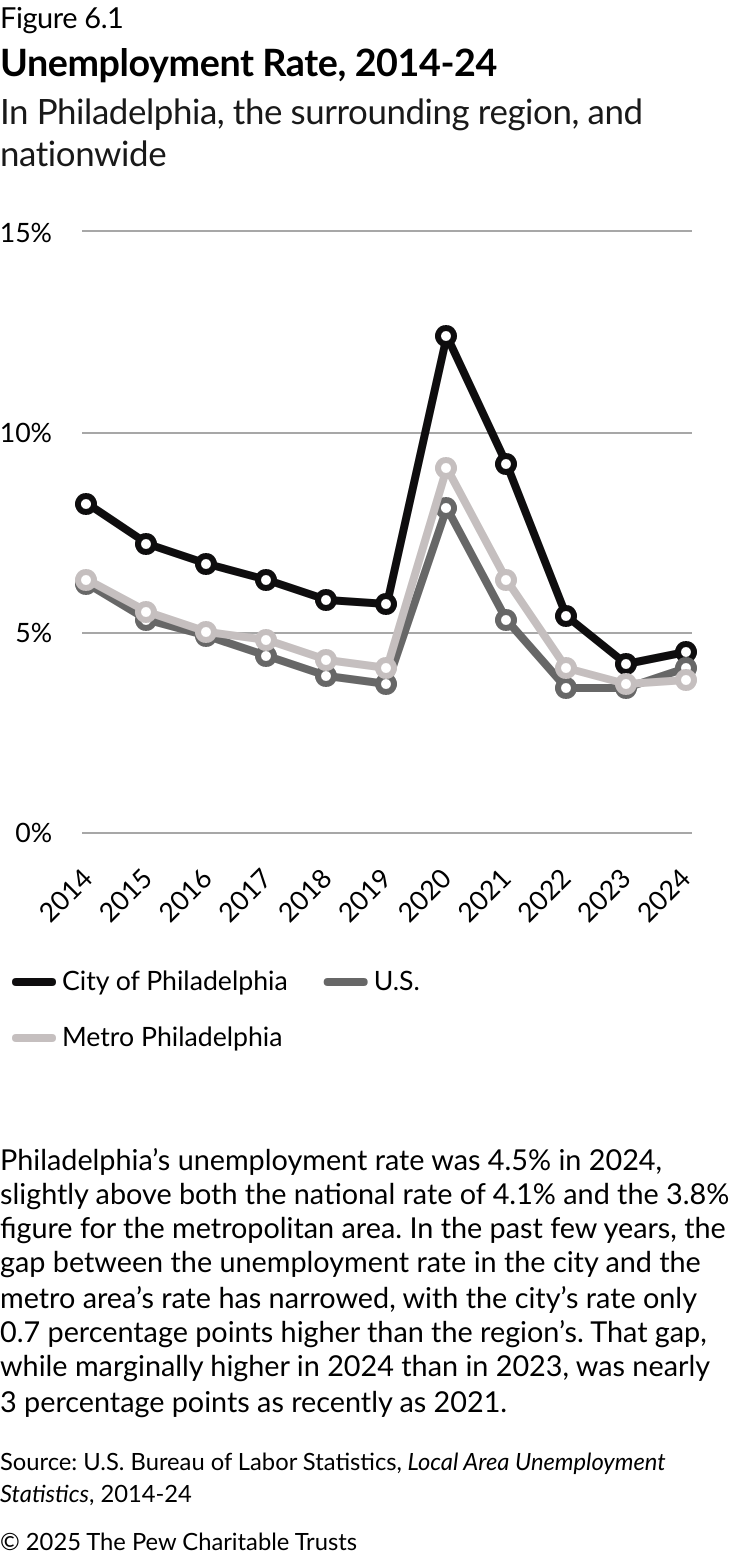
The local economy had an estimated 791,400 jobs as of December 2024, up nearly 19,000 compared with the previous year. The unemployment rate remained below 5% for the second year in a row. Median household incomes rose, reaching $60,302 in 2023—up nearly 7% from the previous year.
Education and health services, as well as leisure and hospitality, continued to pace the local economic expansion, posting the largest growth of any sectors compared with the previous year.
And Philadelphia remained a city of small businesses, which account for more than 92% of all firms in the area.


Public safety
Like many cities throughout the country, Philadelphia experienced a decrease in both violent crimes and property crimes in 2024. The number of homicides was at a 10-year low last year, at 269—more than 50% below the historic high of 562 recorded in 2021.
Although the total number of major crimes has declined, theft-related offenses still are the most prevalent types of property crimes, with increases in offenses such as retail theft and motor vehicle tag theft. Aggravated assault was the only type of violent crime that did not decrease in 2024.
True or False?
True or False?


Transportation
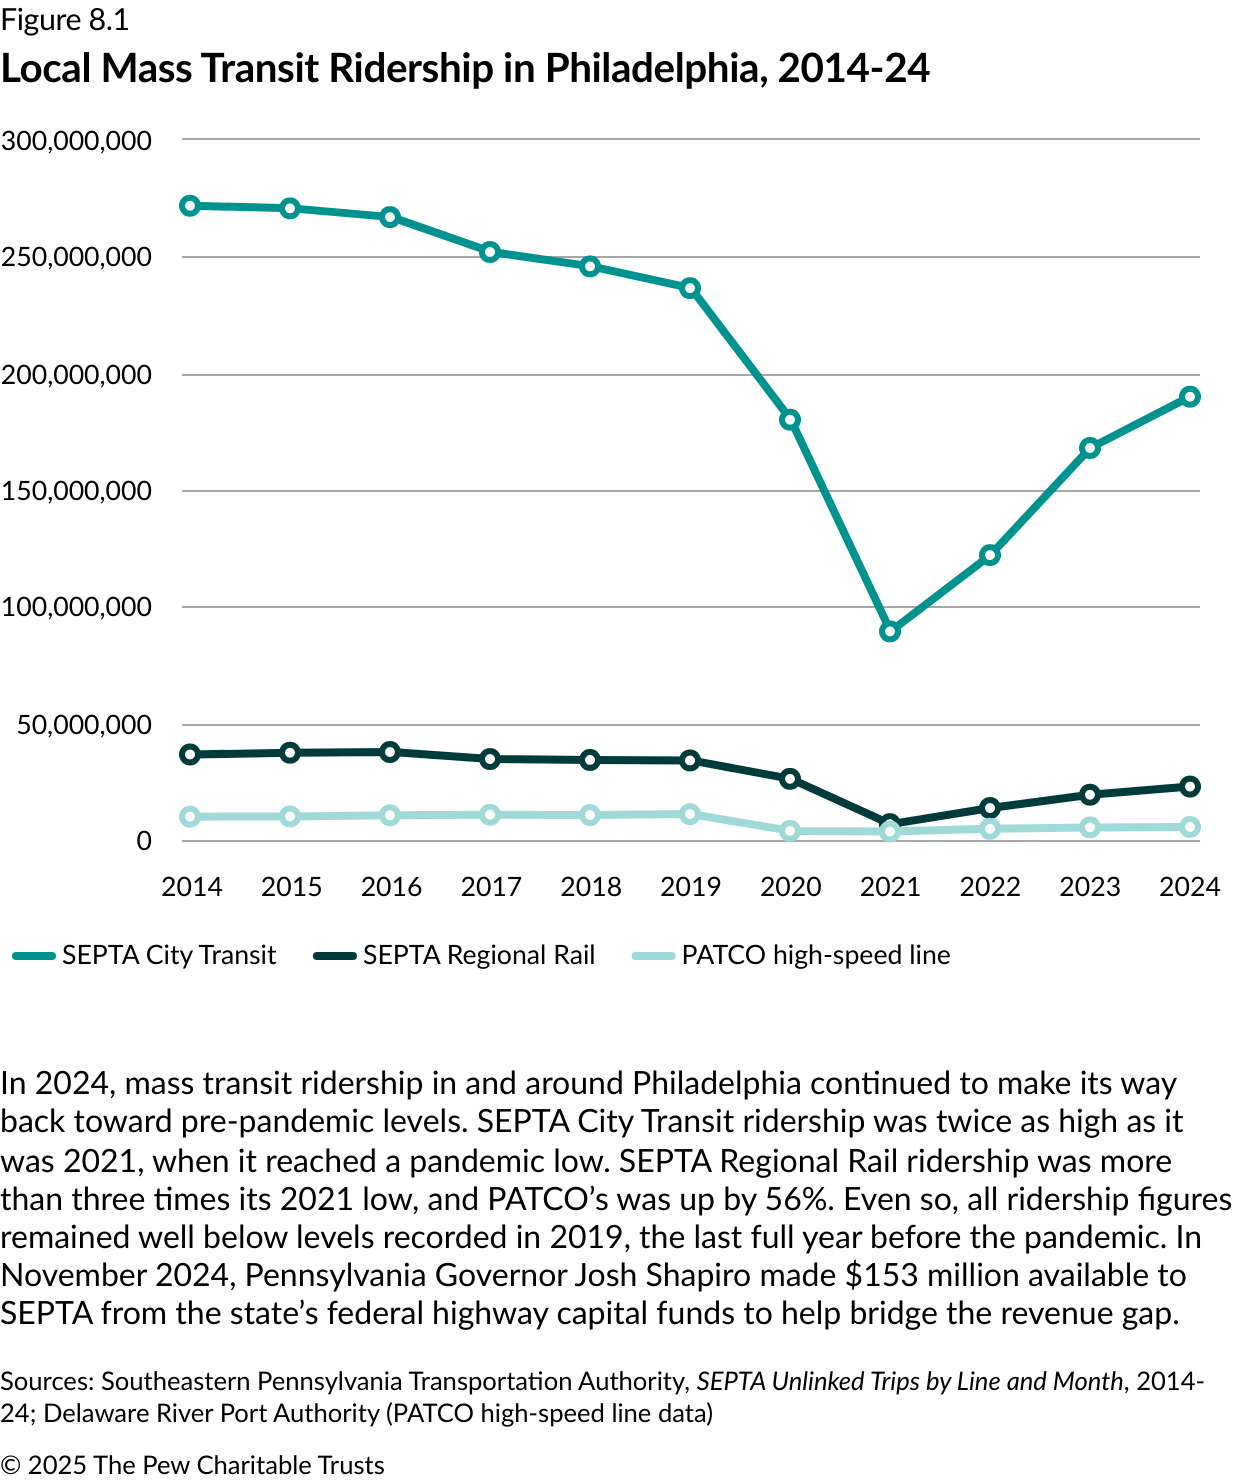
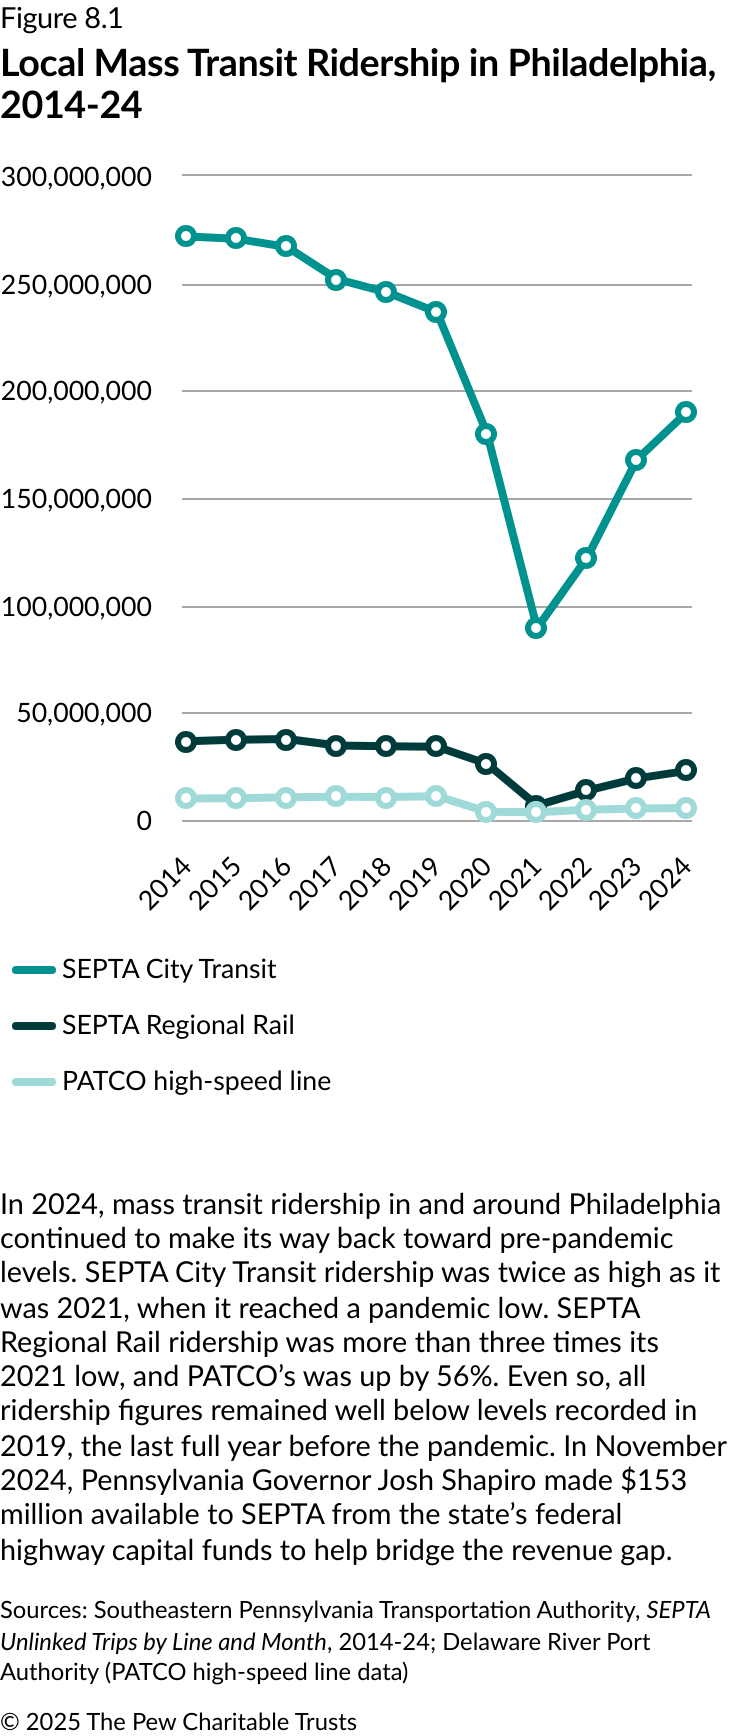
Ridership on the key transportation systems serving Philadelphia—SEPTA, PATCO, and Amtrak—increased in 2024. However, the number of passengers still has not returned to pre-pandemic levels.
In fact, the growth in ridership on SEPTA and PATCO slowed in 2024, indicating that both transit systems may be experiencing permanent decreases in ridership as a result of the COVID-19 pandemic. SEPTA’s reduced numbers are significant given the central role it plays in city and regional travel. And since federal American Rescue Plan Act funding expired at the end of 2024, the transit agency has faced a structural deficit. SEPTA’s ability to maintain current service levels and avoid fare increases remains in doubt because of uncertainty about funding that it has been counting on receiving from the commonwealth by the end of the fiscal year.
Amtrak, meanwhile, experienced a significant increase in ridership into and out of Philadelphia in the 12 months ending in September 2023, the most recent year for which data was available. And although passenger traffic increased at Philadelphia International Airport, it also remains below pre-pandemic levels.
Community Gardens in Philadelphia, 2025
A map shows community gardens as leaves. Many of the gardens are in South Philadelphia’s 19147 ZIP code. There are four registered community gardens in the Northwest, two in the Southwest, and two in the Northeast, where they are vastly spread out.
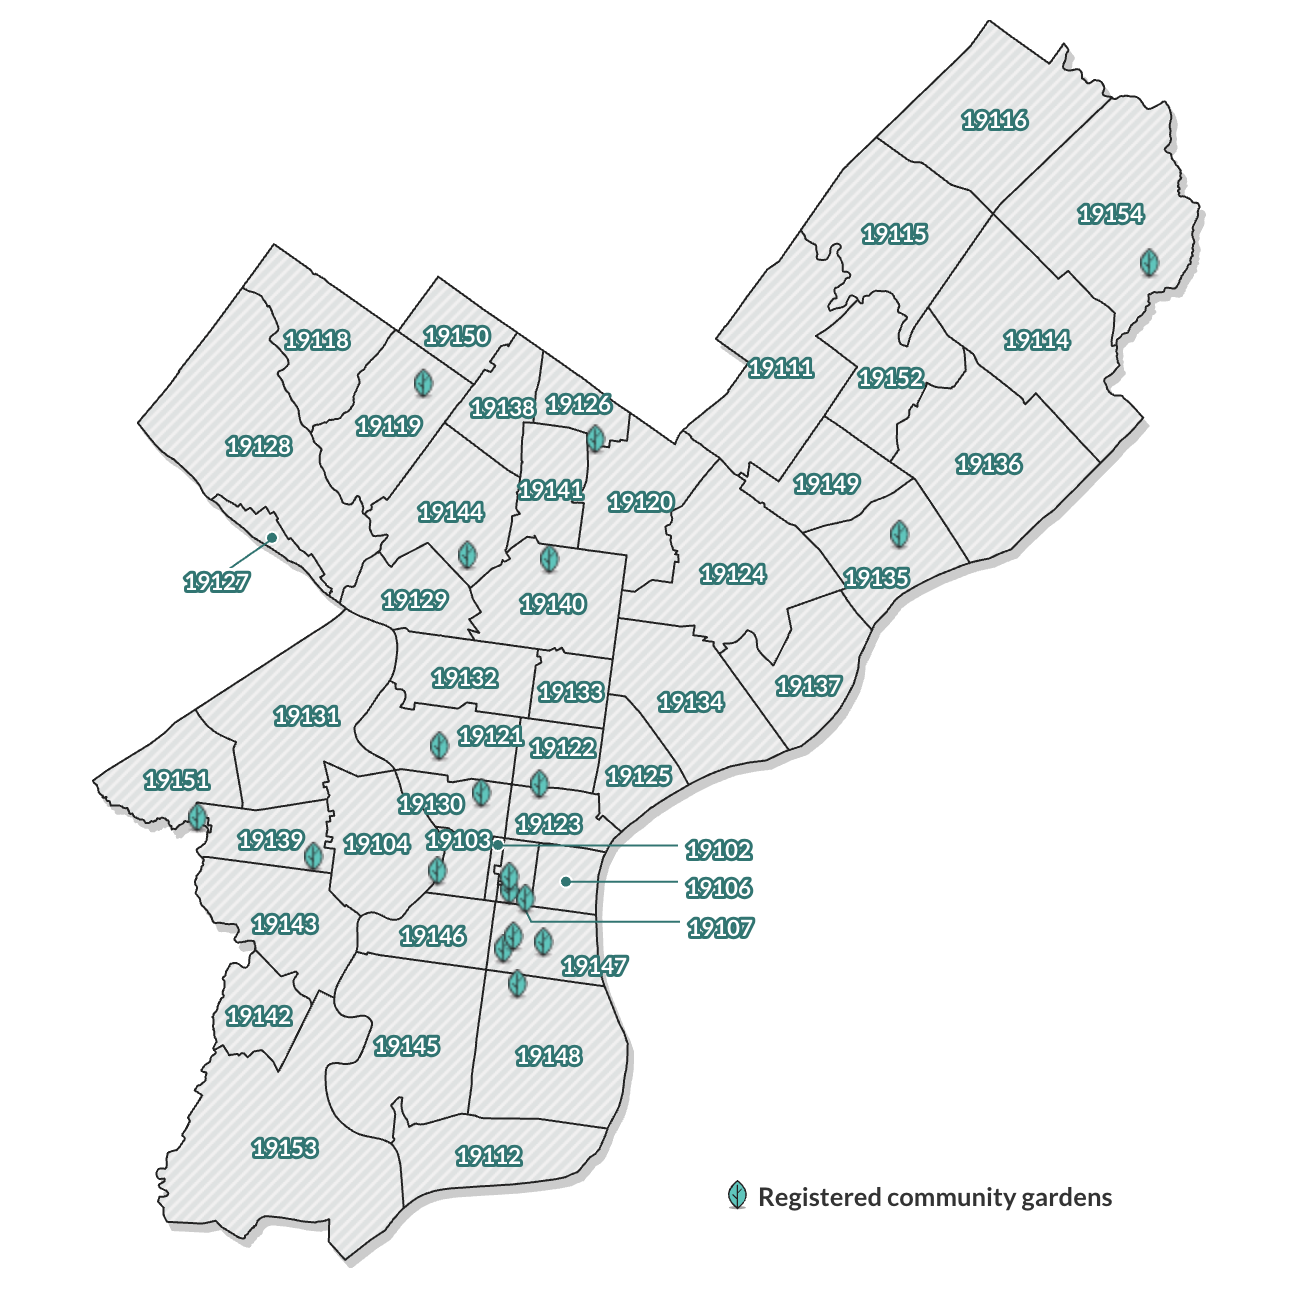
Community gardens provide people with the opportunity to grow produce and are also a place of connection. Philadelphia has 19 registered community gardens, with the largest number of them located in and around ZIP code 19147, which includes the South Philadelphia neighborhoods of Queen Village and Bella Vista, near Center City.
Source: City of Philadelphia, OpenDataPhilly, Registered Community Gardens, 2025
© 2025 The Pew Charitable Trusts View image View image


