The Demographics of Immigrant Workers in Philadelphia
Foreign-born workers have helped fuel growth, and their wages and occupations vary by English proficiency, origins, and education

Overview
Most of Philadelphia’s 158,000 foreign-born workers—representing 1 in 5 working residents in 2022 and growing—work for either low or high wages, with few earning somewhere in the middle. The majority have very little formal education or a lot, with few in between. Half hail from East Asia, Southeast Asia, South Asia, or the Caribbean, but incomes vary dramatically across all national origins.
Immigrants play an outsize role in the city’s labor force, accounting for about a third of its total growth since 2010 and increasing in almost every industry sector, as their overall population has grown to 15.7% of the city total. Much of the reason is that a bigger share of immigrants than U.S.-born residents are ages 25-54, considered the prime age for work and earnings. And it sets them apart on many labor-related metrics.
To better understand the makeup of foreign-born civilian workers, The Pew Charitable Trusts divided this diverse population into three groups by individuals’ annual wages over the 2018-22 period, as found in the U.S. Census Bureau’s American Community Survey: High-wage workers earned at least 20% above the citywide median wage, or more than $54,400; low-wage workers made less than 20% below the median, or less than $36,300; and middle-wage workers earned plus or minus 20% of the median, or between $36,300 and $54,400.1 While individual workers’ wages may not constitute a household’s entire income, they provide a useful categorization for viewing the attributes of foreign-born workers and their place in the city and the regional labor force.
Residents of prime working age
In the 2018-22 period, 57% of foreign-born Philadelphians overall were of prime working age (25-54), compared with 40% of U.S.-born residents. (See Figure 1, which shows the breakdown by sex and age.) That’s a major reason why immigrants’ share of the labor force surpassed their share of the overall population (20% versus 15.7%). It also helps explain why immigrants were more likely than U.S.-born Philadelphians to be employed or looking for work (66% versus 62%), to have jobs outside the city (15% versus 9%), and even to have more workers per household (1.26 versus 1.04).
Attributes of immigrants by wage level
Around half of Philadelphia’s foreign-born workers in the 2018-22 period can be categorized as low-wage workers, earning less than $36,300 a year in wages and salaries (adjusted for inflation), excluding other income. Growing even faster than the overall immigrant population since 2000, the low-wage group more than doubled in size to well over 67,000 by the 2022 period, not counting thousands of unemployed, intermittent, and hard-tocount workers.2 (In contrast, U.S.-born low-wage earners held steady at 38% of the U.S.-born total after growing 18% over the period.)
In this low-wage category, a third of working immigrants struggled with English, and more than half had just a high school diploma or less. The most common jobs were in manual services, including many roles that have faced severe worker shortages in recent years, such as food preparation, health care support, and truck driving. Four in 10 hailed from Central America, the Caribbean, or South America, the largest continental grouping. Half were noncitizens, which included lawful immigrants, refugees, and immigrants without permanent legal status. (Future reports in this series will look at these groups in greater detail.)
At the other end of the pay spectrum, the high-wage group represented about 30% of immigrant workers living in Philadelphia in the 2018-22 period. Their numbers also more than doubled since 2000, to around 39,000. (In comparison, U.S.-born high-wage earners made up 43% of all U.S.-born workers after growing 30% over the period.) Around 9 in 10 spoke English well, partly because many came from India, where English is the second official language. Around two-thirds were naturalized citizens, and noncitizens in this wage group included highly skilled temporary workers on coveted H-1B visas.3 Two-thirds had at least a bachelor’s degree, and their most common jobs were in professional or technical fields, including doctors and nurses, data and information specialists, and company managers. The biggest groups by birthplace were from East Asia, Southeast Asia, South/Central Asia, and the former Soviet Union.
The middle-wage group was the smallest, representing less than 20% of all immigrant workers, around 22,500 in the 2018-22 period. Still, the share of middle-wage immigrant workers also has been growing, up 71% since 2000. In contrast, the percentage of U.S.-born middle-wage earners shrank from 23% to 19% of the U.S.-born total after marginal growth over the period. The middle-wage category is key for a city like Philadelphia: It covers jobs that traditionally may not require a college degree but pay enough to sustain a family. Previous research by Pew and others has found a worrisome stagnation in the number of middle-wage jobs in the past decade.
Among middle-wage-earning immigrants, three-quarters spoke English well. Around a quarter had at least a college degree, although sometimes their credentials from foreign institutions are not recognized in the United States, leading them to take jobs below their skill level. Half worked in physically taxing jobs, such as health care support, production, or construction roles. This group had relatively equal representation of immigrants from Latin America (a third), Asia (a third), and Africa (a fifth).
Table 1
Attributes of Philadelphia Immigrant Workers by Wage Level, 2018-22
Percentages of population overall and by education, language, and other attributes
| Low-wage earners (less than $36,300/year) | Middle-wage earners ($36,300 to $54,400/year) | High-wage earners (more than $54,400/year) | |
|---|---|---|---|
| Share of Philadelphia resident immigrants ages 16+ in labor force | 52% | 18% | 30% |
| High school diploma or less | 57% | 44% | 20% |
| Some college or associate degree | 20% | 28% | 14% |
| College or professional degree | 22% | 28% | 66% |
| Speaks little or no English | 36% | 25% | 11% |
| Speaks English well or very well | 64% | 75% | 89% |
| Naturalized citizen |
47% |
58% | 63% |
| Noncitizen |
53% |
42% | 37% |
| Works in Philadelphia | 85% | 88% | 83% |
| Works outside Philadelphia | 15% | 12% | 17% |
| Top five occupations |
|
|
|
| Top five regions of origin |
|
|
|
|
Notes: Percentages have a margin of error of plus or minus 4 to 6 percentage points; occupations were most reported out of 23 categories; subregions were most reported out of 21 regions; “noncitizen” includes lawful permanent residents (“green card” holders), immigrants without permanent legal status, temporary workers, and students. See methodology for details. Source: U.S. Census Bureau, American Community Survey, five-year estimates, obtained from IPUMS USA at University of Minnesota, http://usa.ipums.org |
Although immigrants have outpaced the growth of U.S.-born workers at every wage level, their effect on pay levels overall—for both U.S.-born and foreign-born Philadelphians—remains a subject of study. Researchers have found that immigrants who work for low pay don’t necessarily pull down those wages for comparable U.S.-born workers and may indirectly push up wages for highly skilled, highly paid workers.4 Pew was unable to analyze this effect specifically for Philadelphia.
Household income by immigrant origins
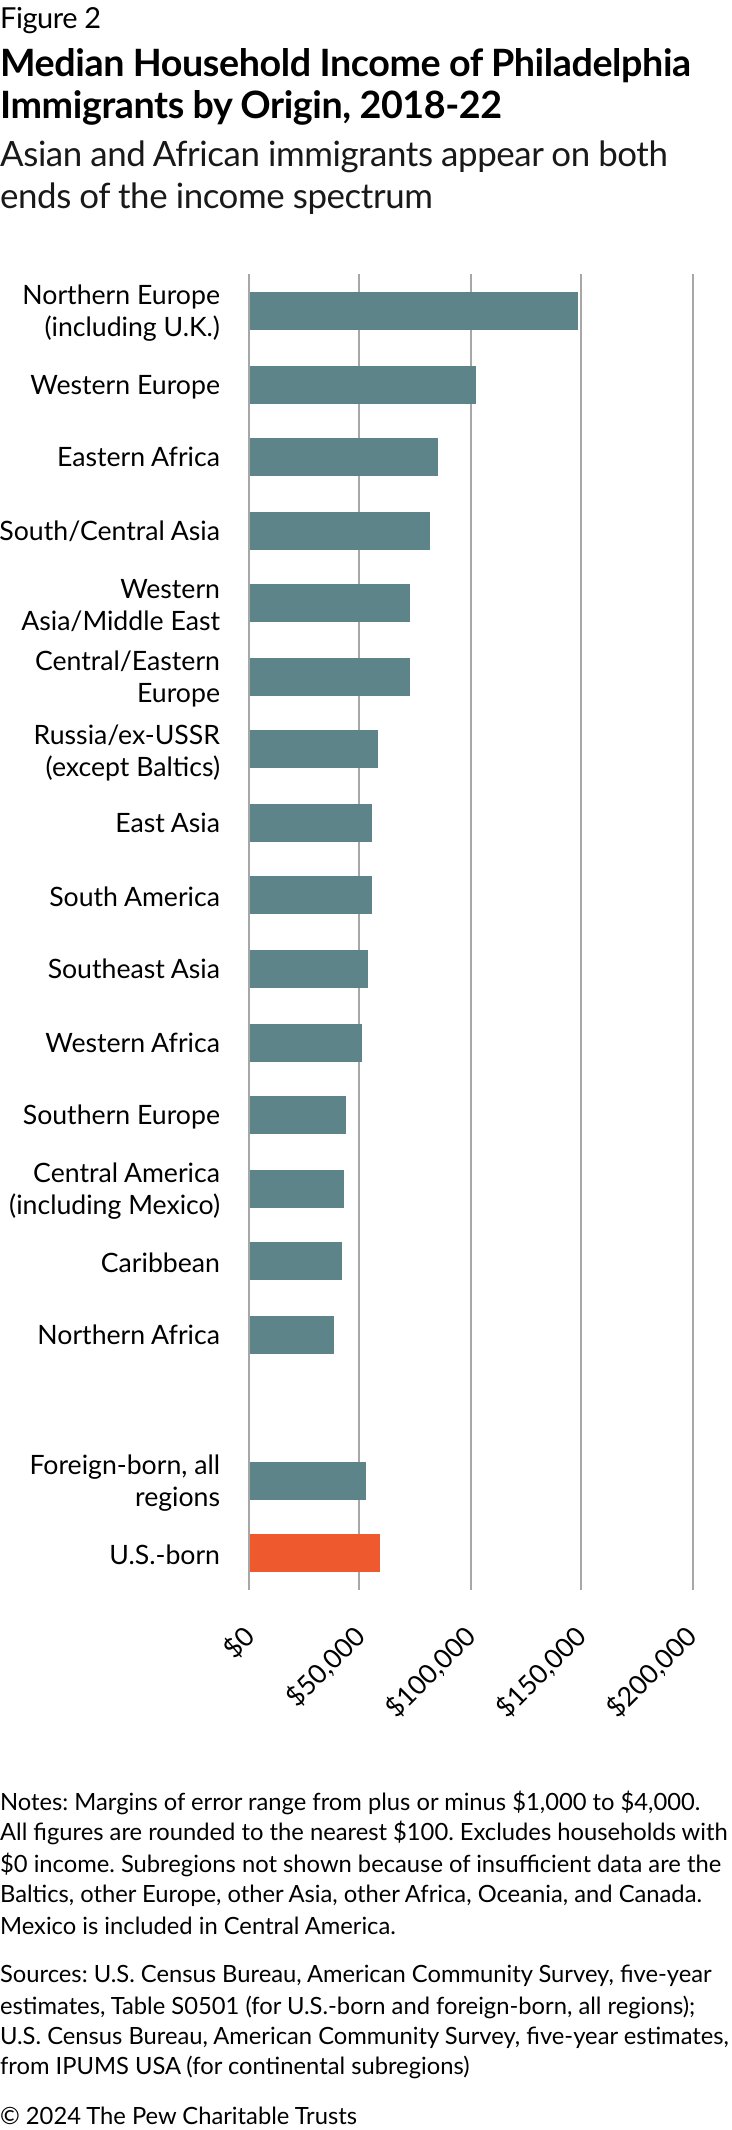
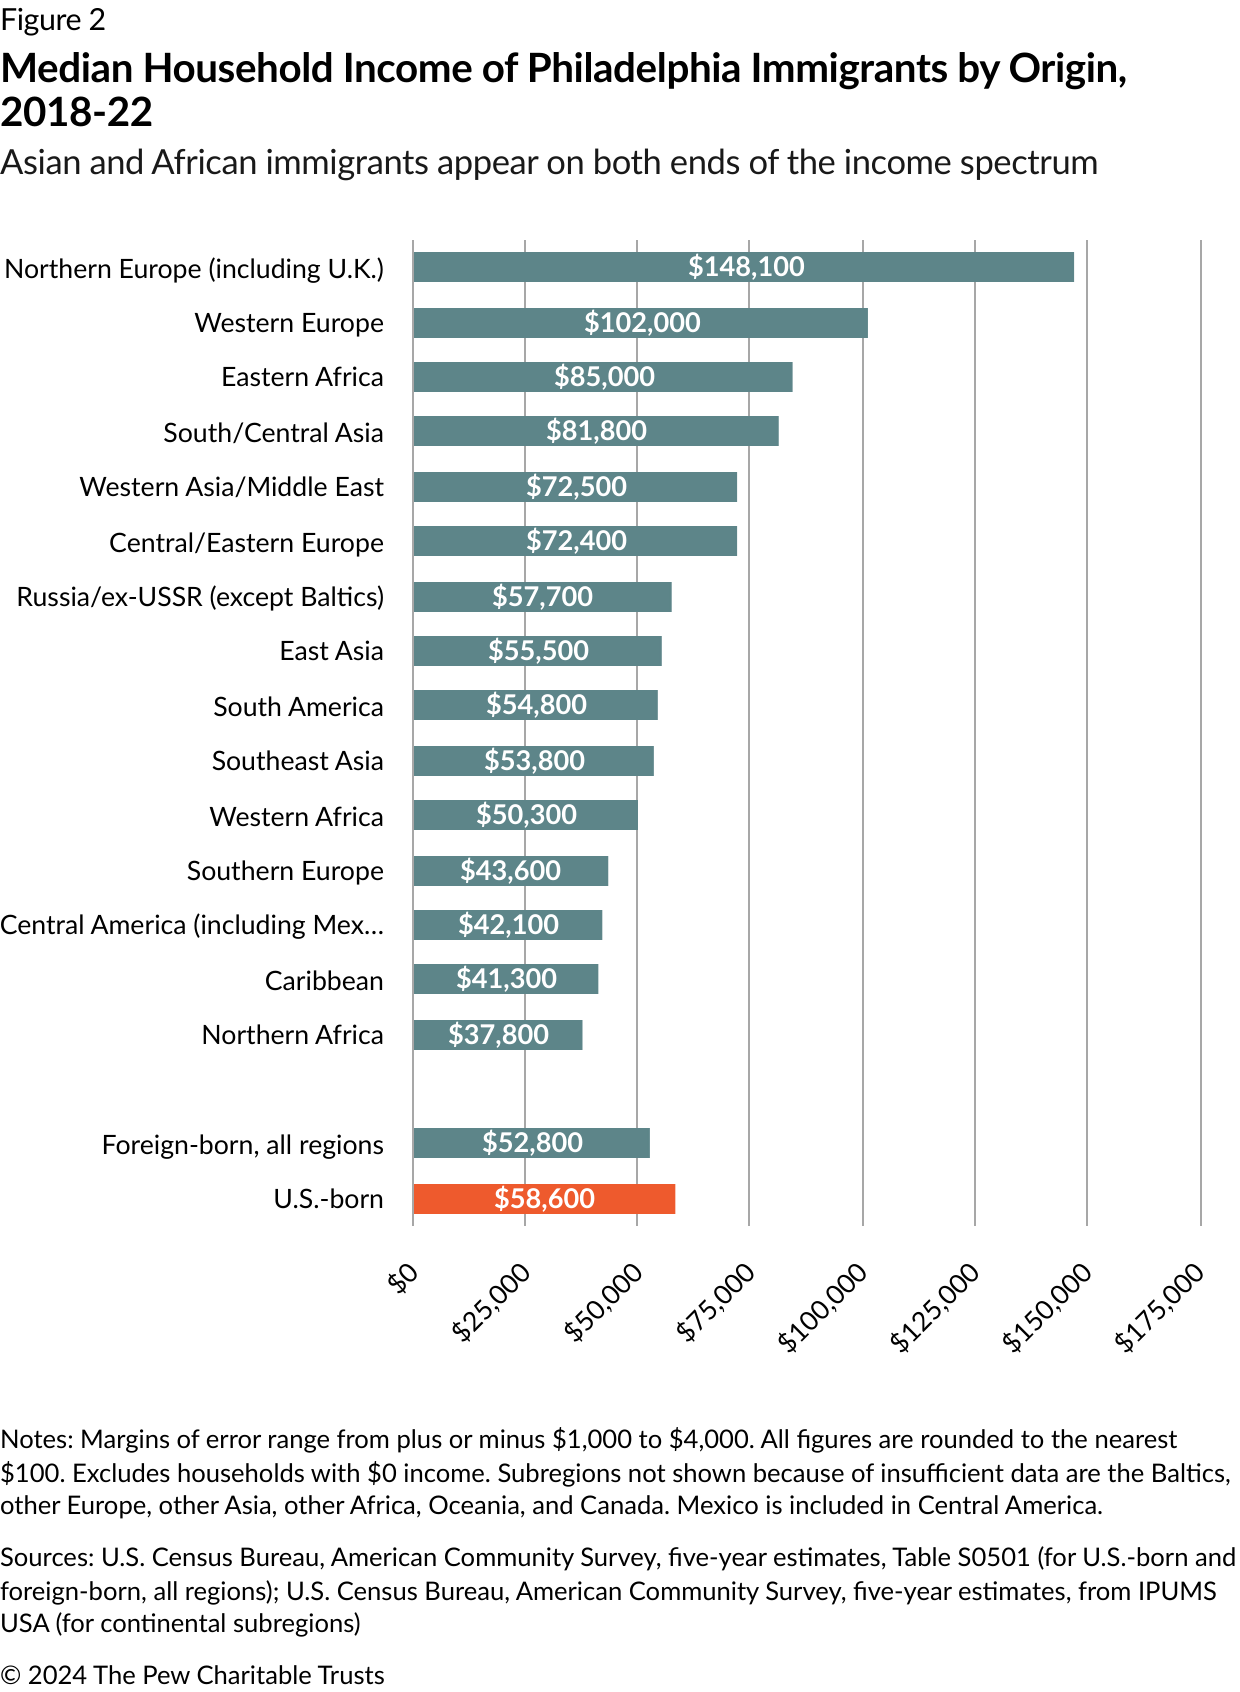
Household income is a broader indicator of economic mobility than workers’ wages alone. Among all city households in the 2018-22 period, the median income of immigrant-led households was $52,800, below that of U.S.-born residents, at $58,600. But further analysis shows wide income diversity by national origin. For example, East African-led households rank relatively high in household income, while Southeast Asian-led households appear on the low side in terms of income. (See Figure 2.)
The results may run counter to stereotypes that some groups say they face. “In the Asian community, the ‘model minority image’ has been problematic,” said Andy Toy, policy director of the Philadelphia Association of Community Development Corporations and a longtime community activist. “It gives the impression that Asian Americans don’t encounter problems, that they all have no need for money or other critical support, but it’s not true.”

With Philadelphia’s growing immigrant labor force, workers’ rights advocates have raised concerns about a possible increase in unsafe or abusive workplace practices, such as employers withholding pay or retaliating against workers who report problems. Immigrants, especially those without permanent legal status, face suchsituations disproportionately more than U.S.-born workers do but are less likely to report them, Temple University researchers found in 2015.5 The city of Philadelphia’s Domestic Workers Standards and Implementation Task Force reported in 2023 that domestic workers “primarily consisted of women and/or immigrant women, laboring behind closed doors and frequently facing low wages, harassment, almost no benefits, and other forms of worker mistreatment.”
Comprehensive numbers on workplace violations were all but nonexistent. Candace Chewning, director of the Office of Worker Protections in Philadelphia’s Department of Labor, said in a 2023 interview with Pew that the city is working with community and ethnic groups to encourage reporting. But it’s an uphill and complex situation: “We know that employers also often are immigrants themselves, so in reality we are asking immigrant workers to report someone they may know from their community, which adds another layer to the fear they face,” she said. To help counter this fear, the office has produced tip sheets in a few languages on how to report problems.
Immigrant workers are highly diverse by education level, language skills, national origins, and other attributes, which are reflected in the jobs they fill and the wages they earn.
Read our accompanying reports about foreign-born entrepreneurs, along with other installments in this series about Philadelphia’s evolving populations and how immigrants are diversifying the city.
Endnotes
- Pew analysis of American Community Survey five-year estimates obtained from University of Minnesota IPUMS USA, http://usa.ipums.org. Dollar figures over the five-year period are inflation-adjusted to 2022 dollars. To obtain a robust estimate of fully engaged workers’ wages, Pew limited each cohort to city residents ages 16 and older who worked at least 10 hours a week and at least 14 weeks in a previous year. See The Pew Charitable Trusts, “How Can Philadelphia Grow Middle-Wage Jobs?,” 2022, https://www.pewtrusts.org/en/research-and-analysis/issue-briefs/2022/11/how-can-philadelphia-grow-middle-wage-jobs.
- The figure for 2022 alone was around 78,000. Census Bureau research has found that non-English speakers and immigrants without permanent legal status are regularly undercounted. See “Counting Every Voice: Understanding Hard-to-Count and Historically Undercounted Populations,” U.S. Census Bureau, Nov. 7, 2023, https://www.census.gov/newsroom/blogs/random-samplings/2023/10/understanding-undercounted-populations.html.
- Pew analysis of data obtained from data processor MyVisaJobs, https://www.myvisajobs.com, shows 3,712 approved applications to hire H-1B visa holders in Philadelphia in 2022, at average pay of $109,877, which would put them in the high-wage group. The number who have actually been hired is unknown.
- Alessandro Caiumi and Giovanni Peri, “Immigration's Effect on U.S. Wages and Employment Redux,” National Bureau of Economic Research, 2024, https://www.nber.org/system/files/working_papers/w32389/w32389.pdf. See also Zeke Hernandez, The Truth About Immigration: Why Successful Societies Welcome Newcomers (New York: St. Martin's Press, 2024), https://us.macmillan.com/books/9781250288240/thetruthaboutimmigration.
- Amanda Reed, Andrea Saylor, and Margaret Spitzer, “Shortchanged: How Wage Theft Harms Pennsylvania's Workers and Economy,” Sheller Center for Social Justice, Temple University Beasley School of Law, 2015, https://law.temple.edu/csj/publication/shortchanged-how-wage-theft-harms-pennsylvanias-workers-and-economy/.


