Increased Risk, Complex Investment Landscape Require Prudent Pension Management Practices
State retirement system performance, 2021 and 2022

Overview
Effective management of state pension investments is crucial to ensuring the sustainability of retirement benefits for millions of public sector employees, so The Pew Charitable Trusts has tracked state pension investment practices and outcomes since 2012. This chartbook is the latest installment of that work and offers a detailed analysis of recent investment trends, focusing on asset allocation, investment performance, and management fees for 73 major public pension plans in fiscal years 2021 and 2022.
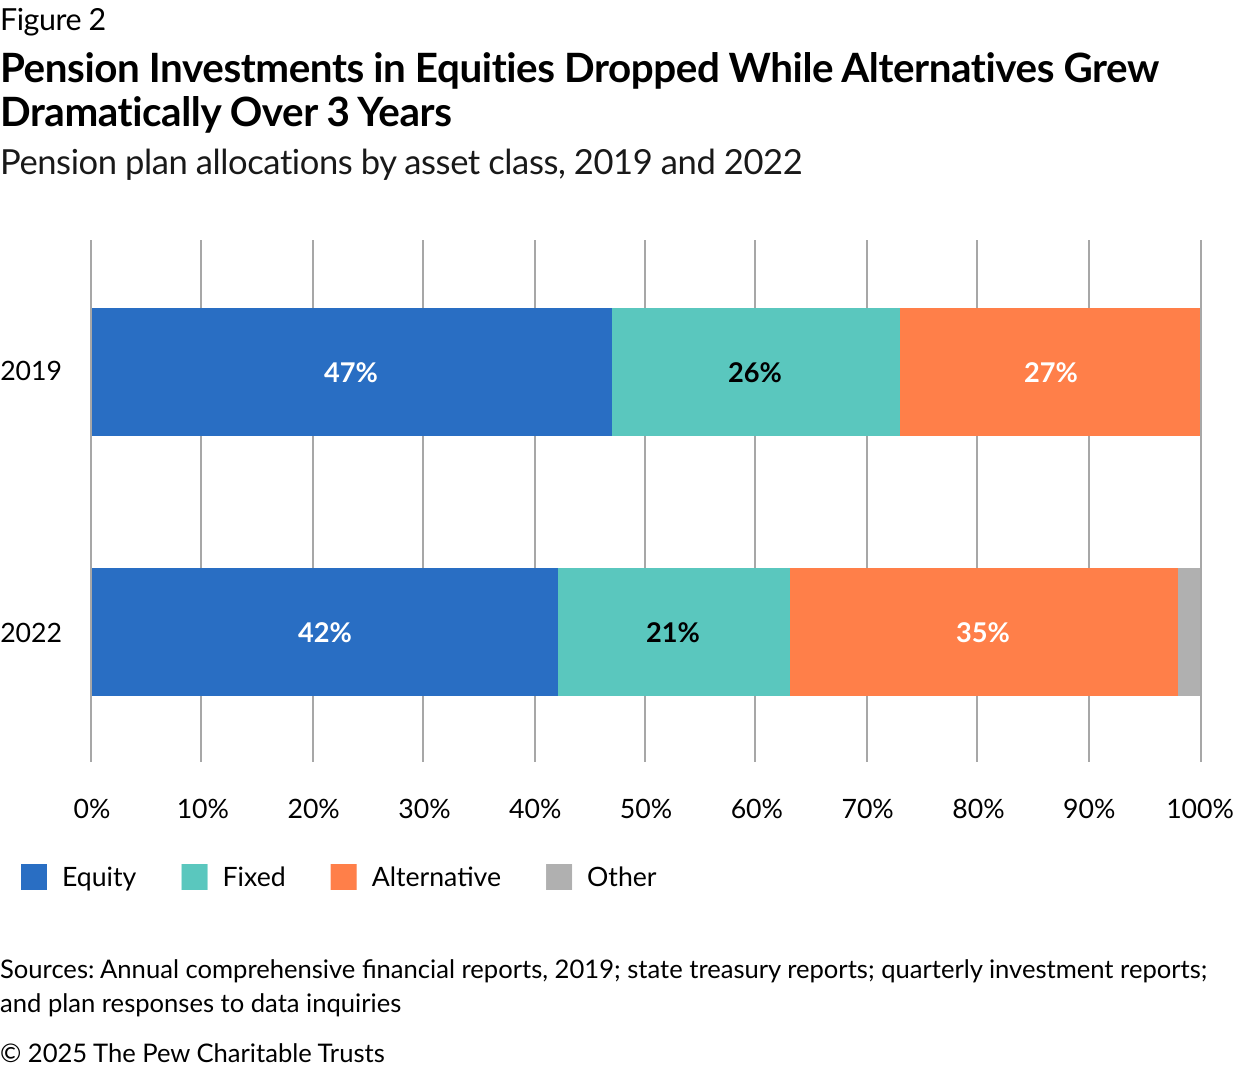
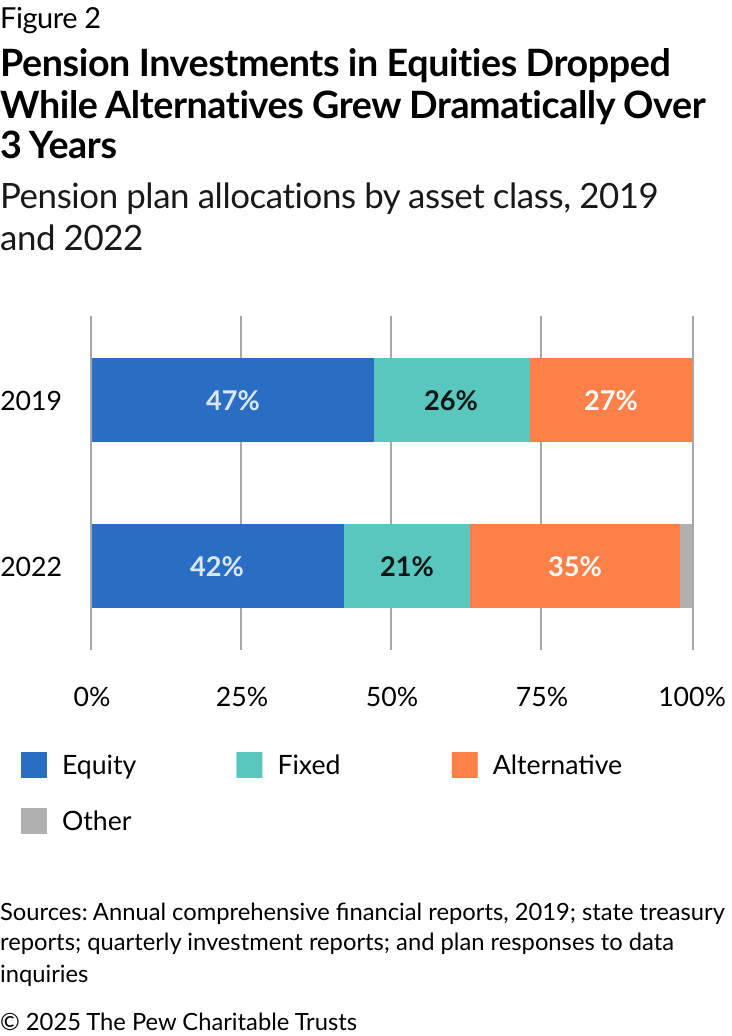
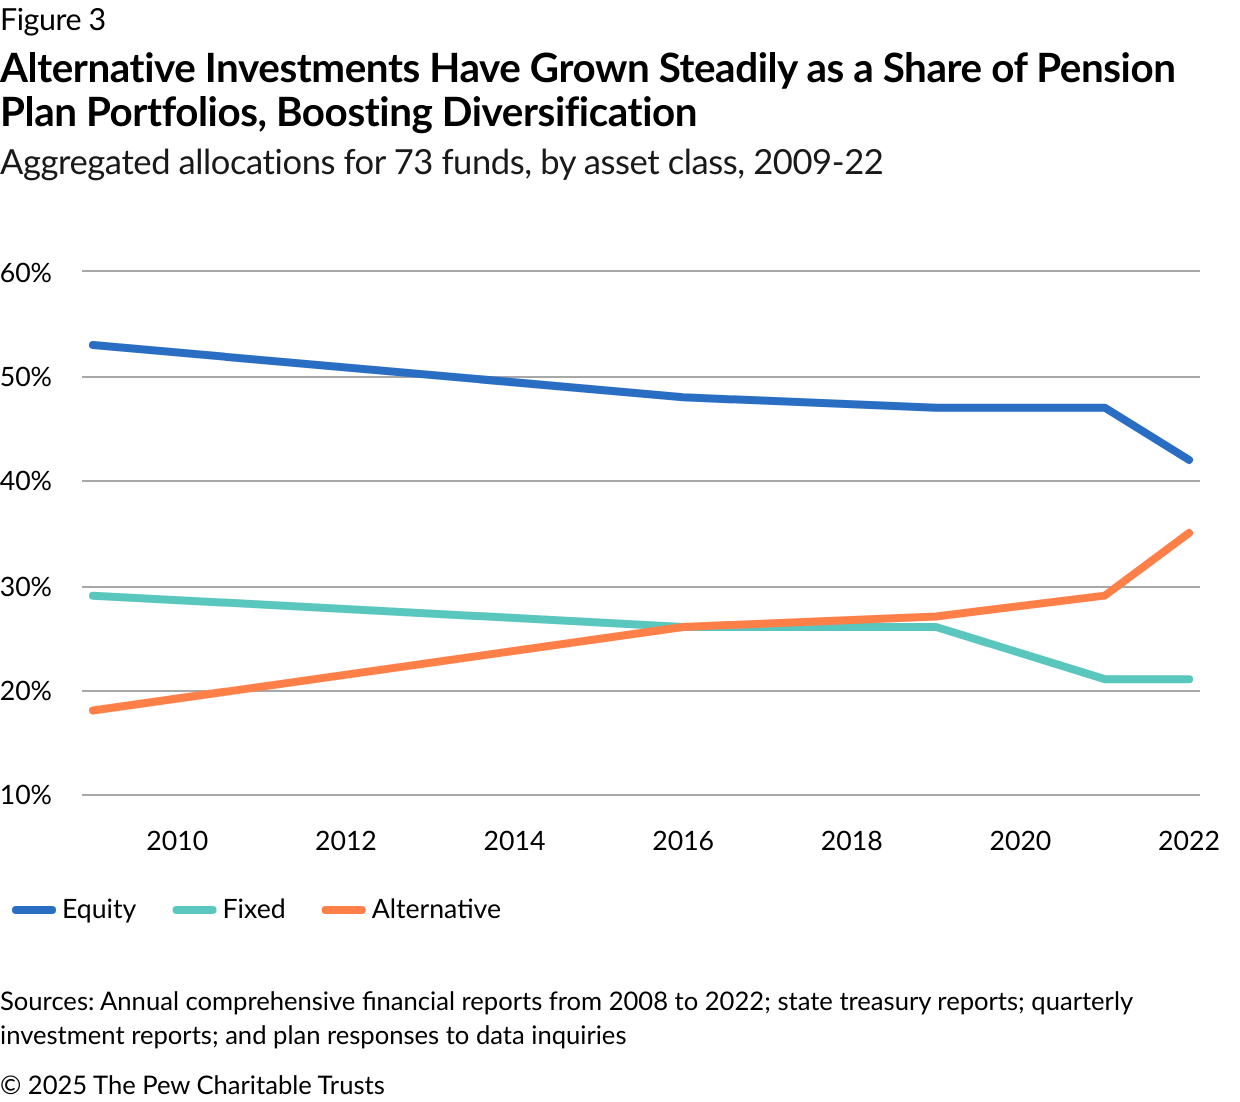
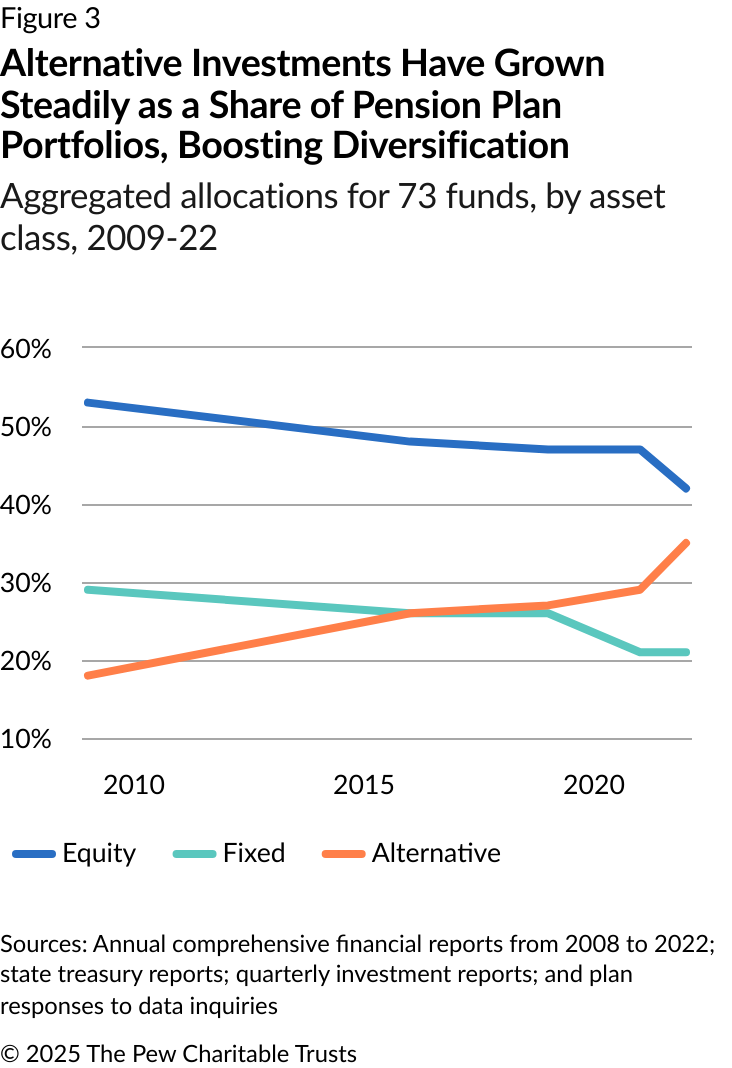
This latest analysis finds that public pension plans have continued a trend, which began in earnest about 30 years ago, of increasing reliance on risky alternative investments, such as private equity, private debt, and real estate, rather than the traditional stocks, bonds, and cash investments that dominated retirement system portfolios in the past. In 2022, the combined share of equity and alternative investments reached 77% of total pension plan assets, compared with 74% in 2019. Although equities still make up the largest asset class, equity investments have declined significantly in recent years, decreasing from 47% of total assets in 2019 to 42% in 2022. That decrease was offset by a substantial expansion in alternative investments, from 27% to 35% of total assets.
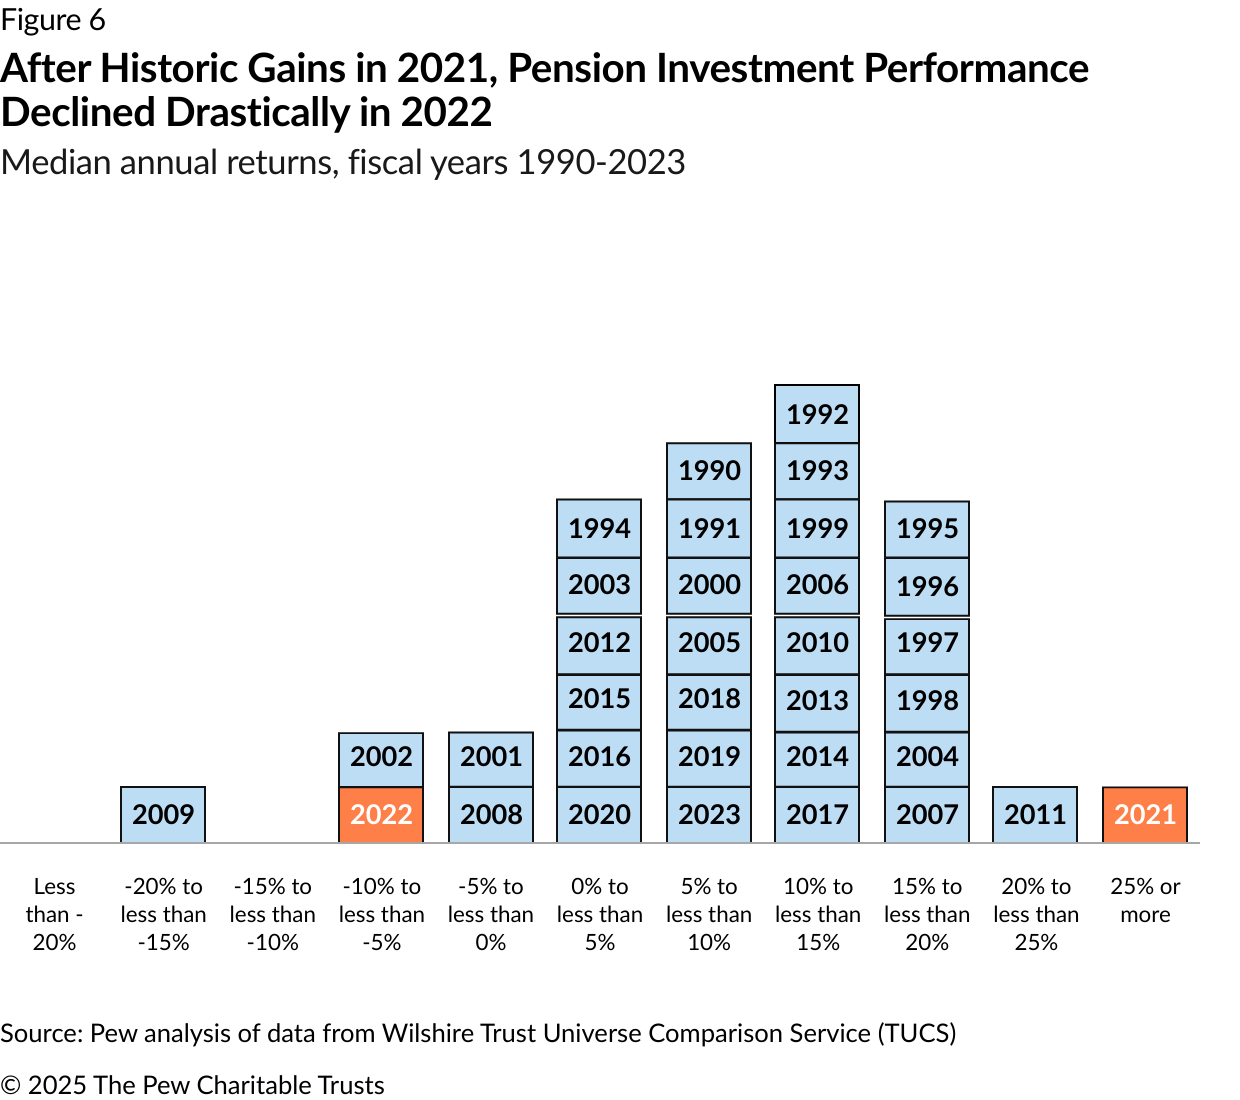
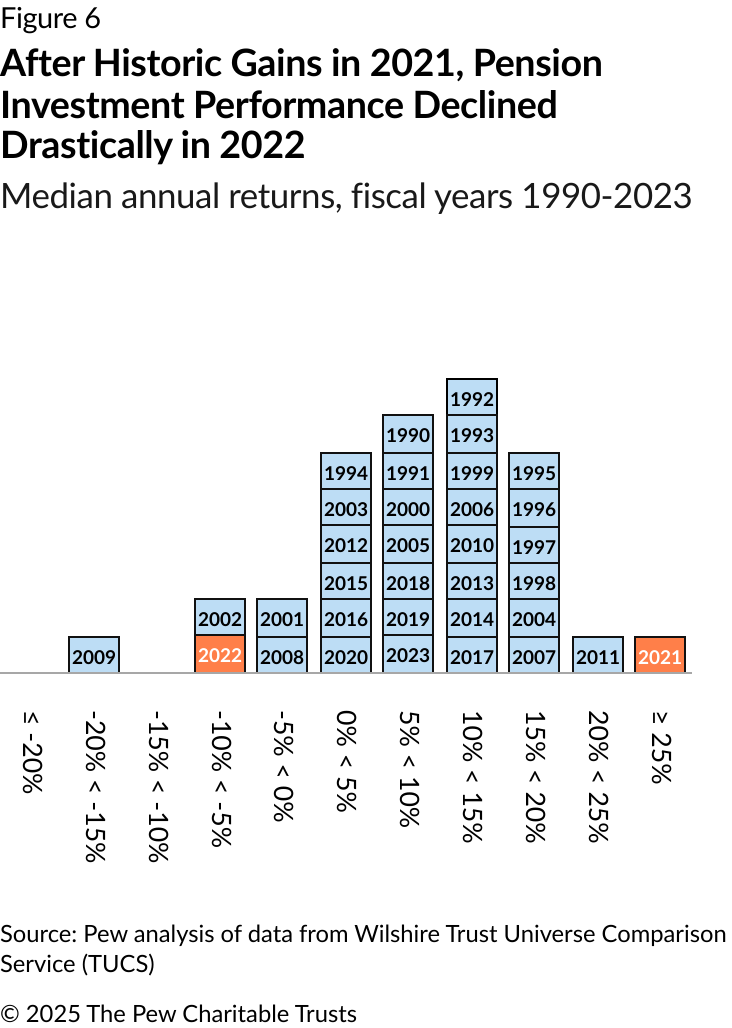
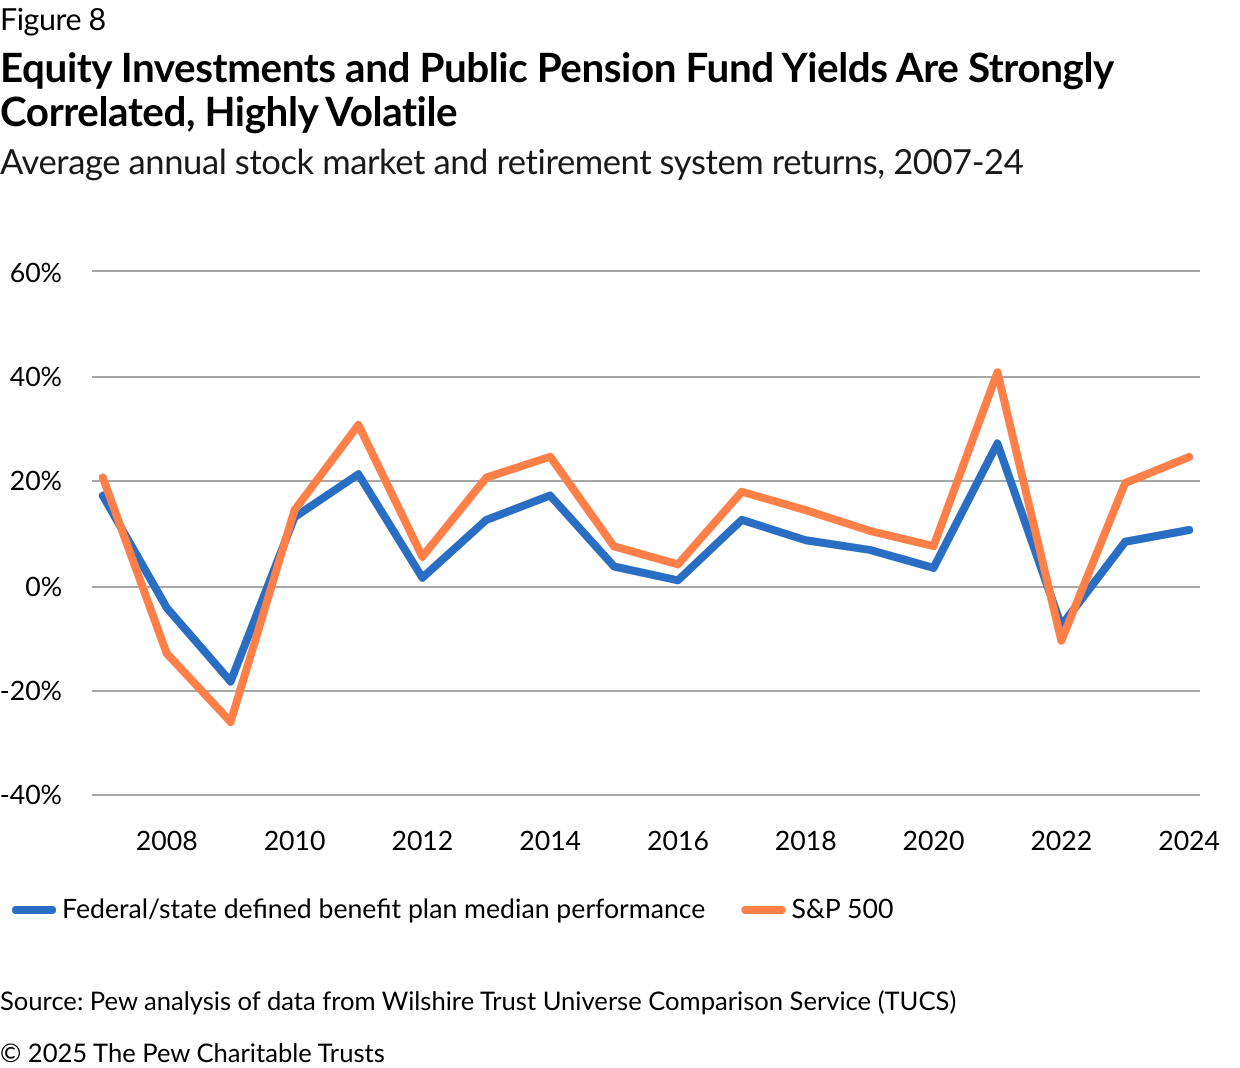
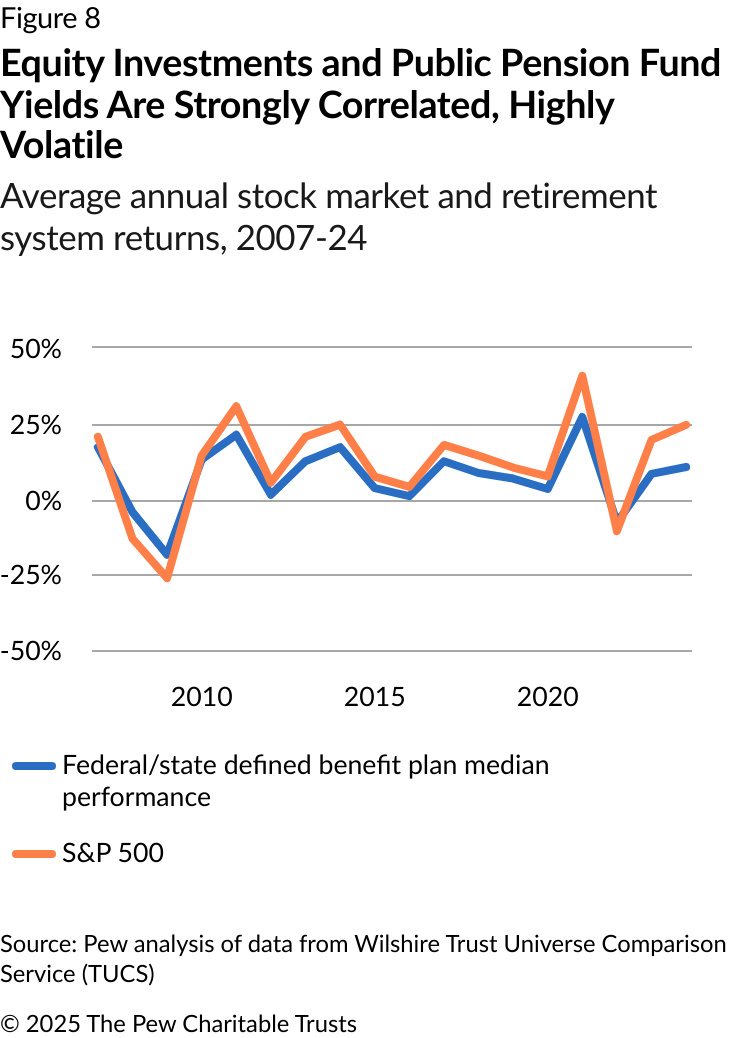
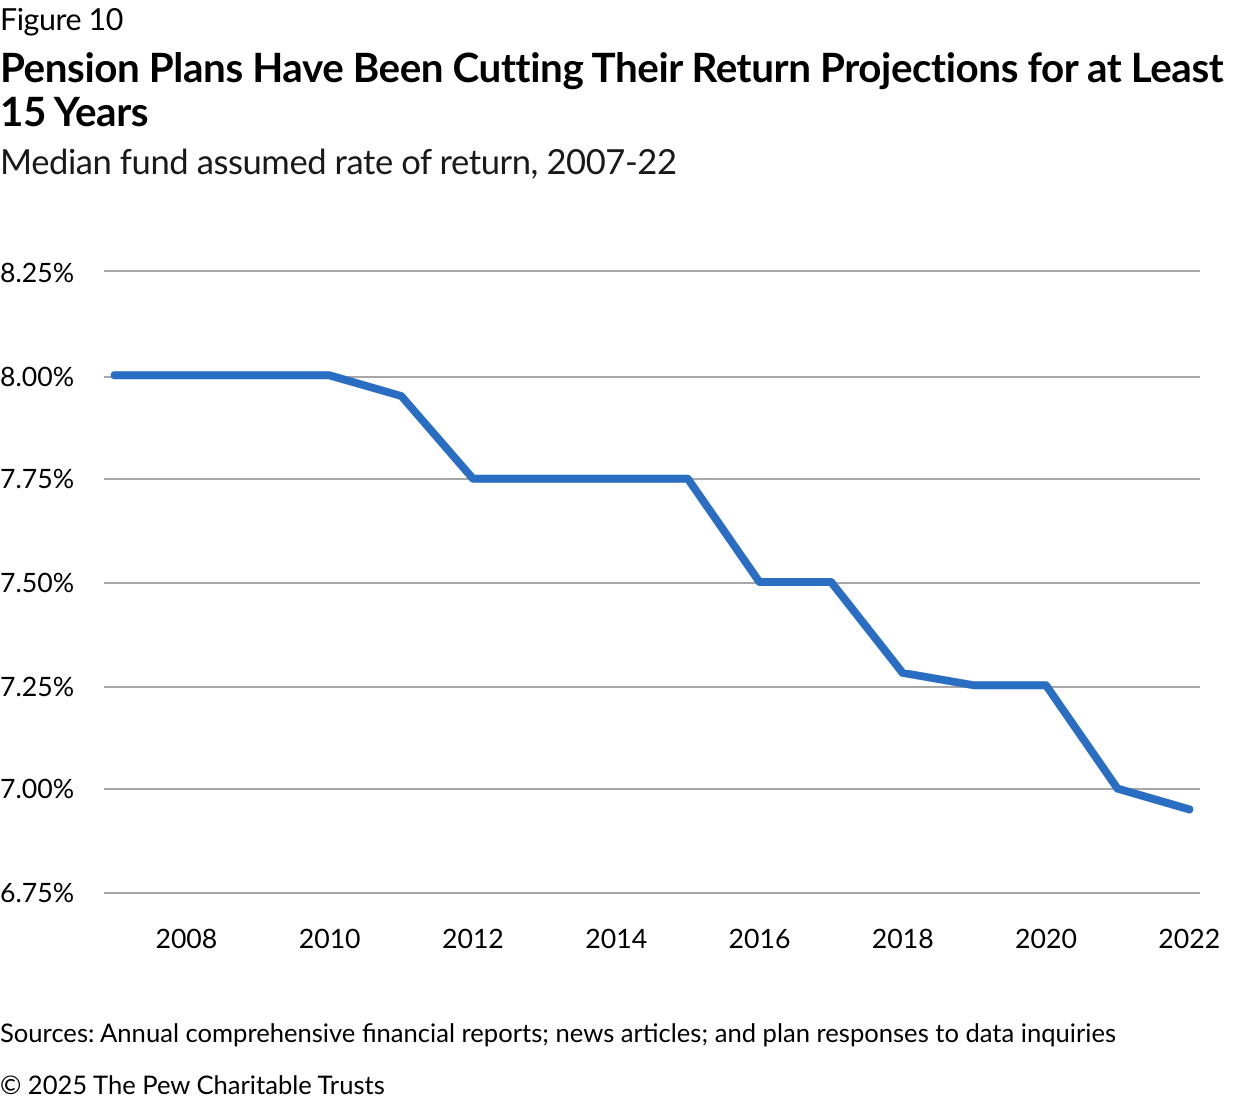
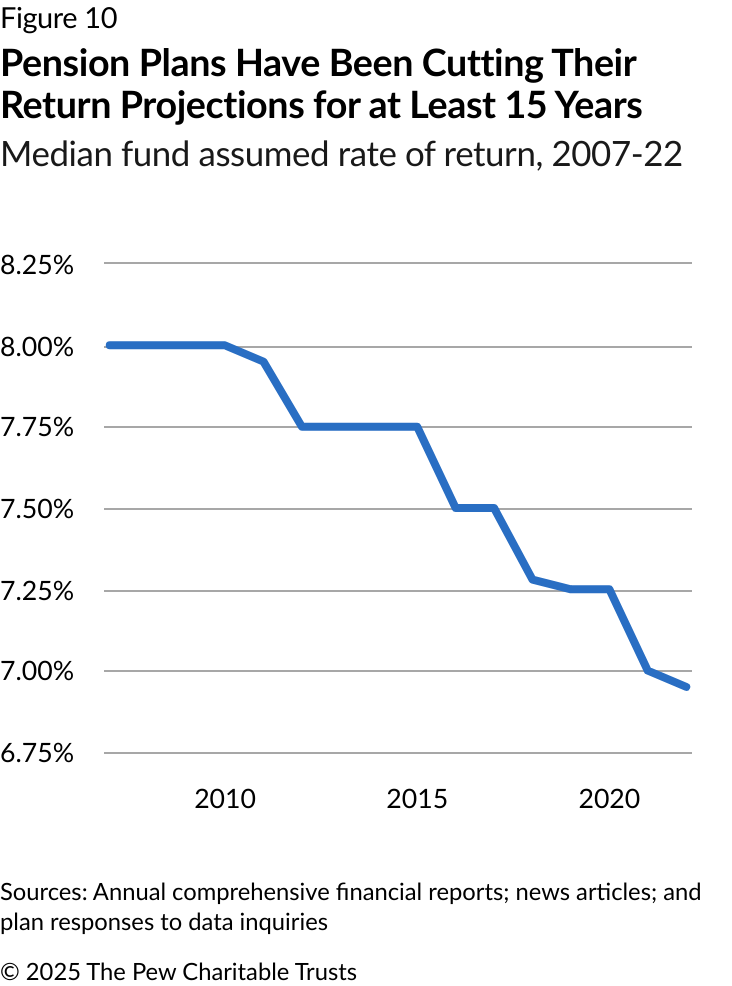
Public pension plans’ investment returns also fluctuated dramatically during the study period. In 2021, average returns for all pension plans reached a historic high of 27%. However, from this peak, returns plummeted by more than 30 percentage points, reaching -4.8% just one year later. This severe volatility closely mirrored the broader markets and underscores the risks inherent in plans’ current investment strategies. Moreover, despite the dramatic stock market rally in 2021, pension funds’ anticipated returns have declined steadily since 2010. Public pension plan administrators have cut their return assumptions to about 7%, adopting projections that more accurately reflect current economic conditions and past investment performance.
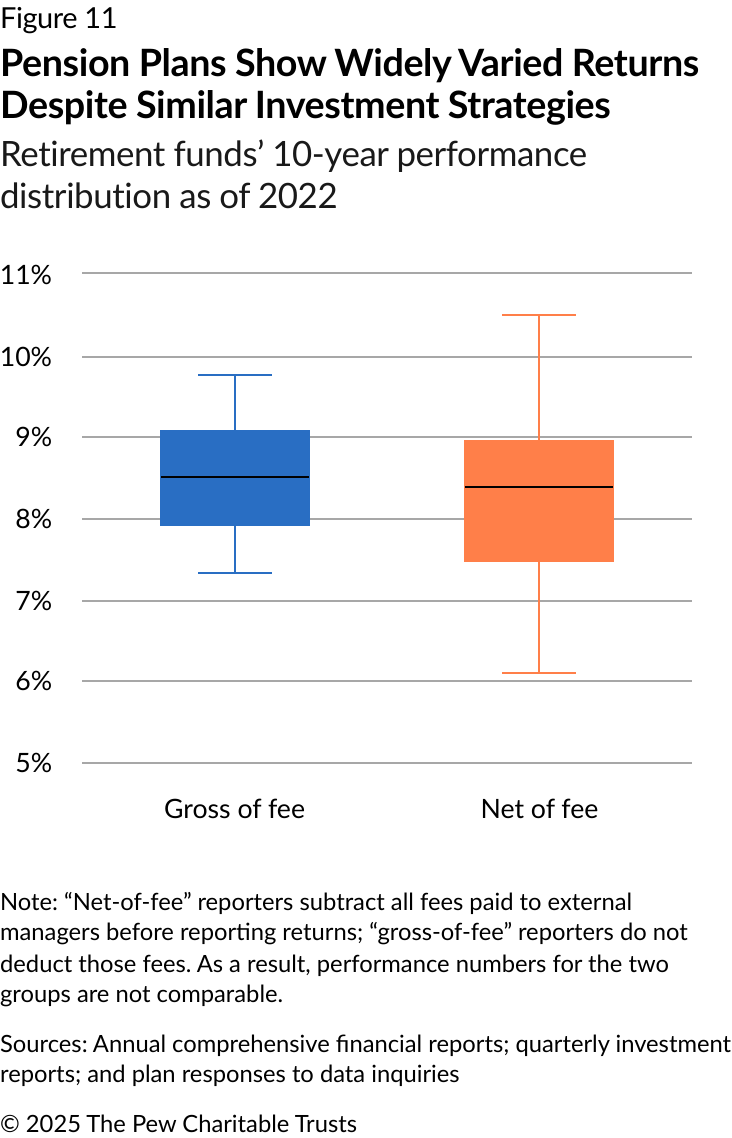
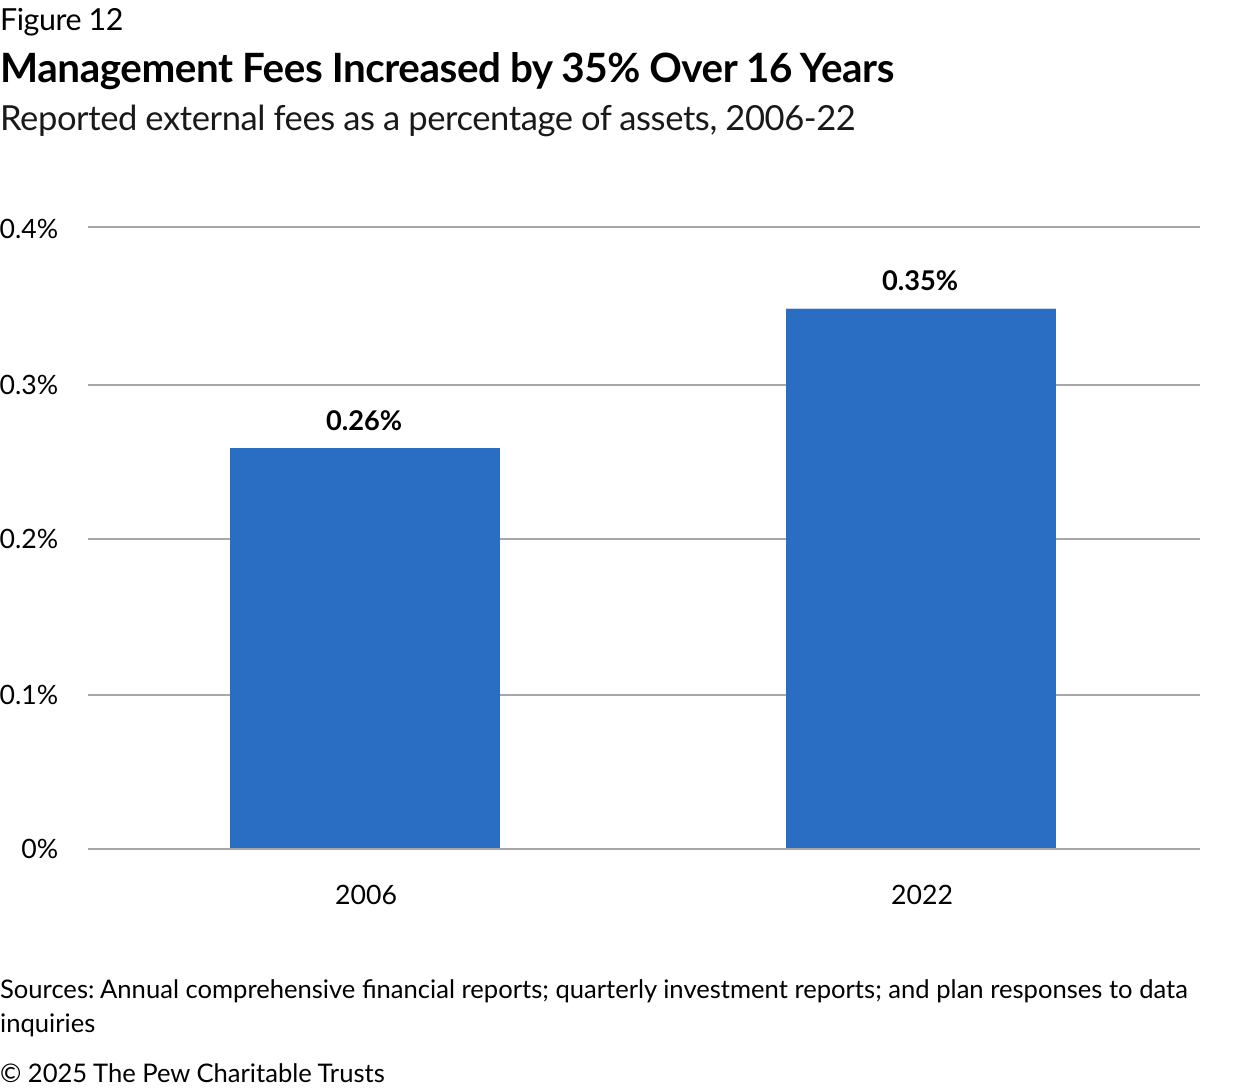
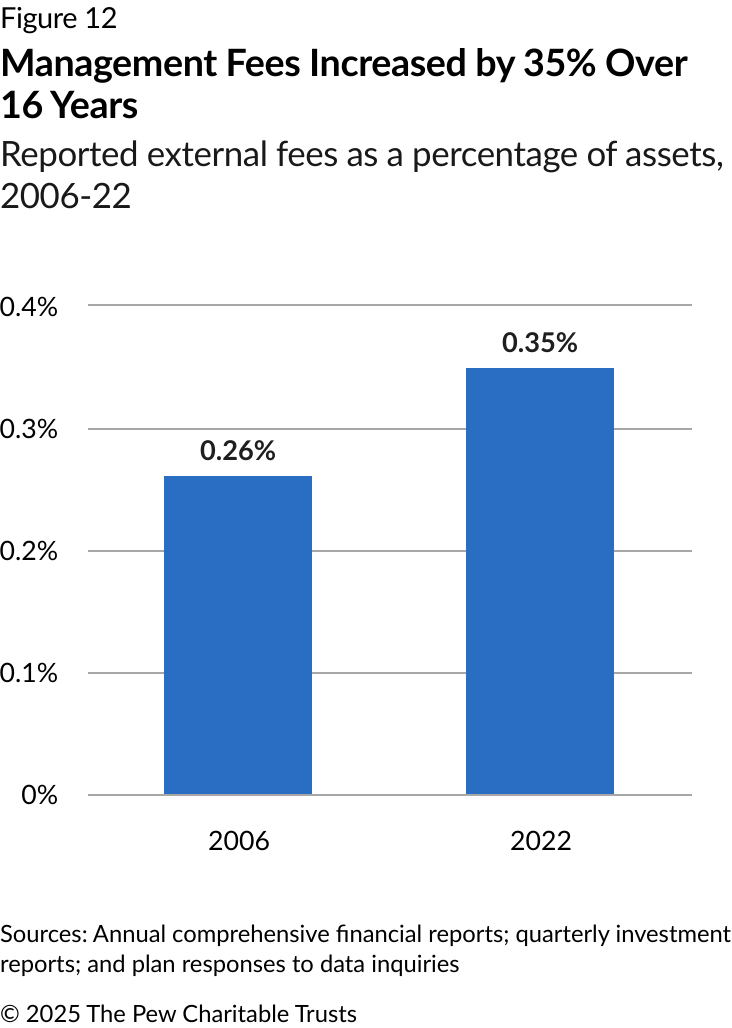
Further, in addition to the fiscal challenges associated with declining projected returns and riskier assets, public pension funds are facing rising costs associated with their increased use of alternative investments, which typically command higher fees than do traditional investments. In 2022, the studied retirement systems collectively reported more than $16.5 billion in fees and investment expenses, with a 50-state average of 0.35% of investments—a 35% increase since 2006. Pew’s research also reveals that these fees significantly affect the total costs of pension investments. And as those costs rise, transparency in reporting becomes increasingly important to ensure accurate assessment of plan performance and management.
This chartbook looks in depth at the evolving landscape of public pension plans in the United States, illustrating the decades-long shift toward riskier investments, the increasing volatility in performance, rising fees, and the cautious outlook for future returns. These findings underscore the need for prudent management and strategic adjustments to ensure that public pension plans can navigate the challenges and opportunities they face.

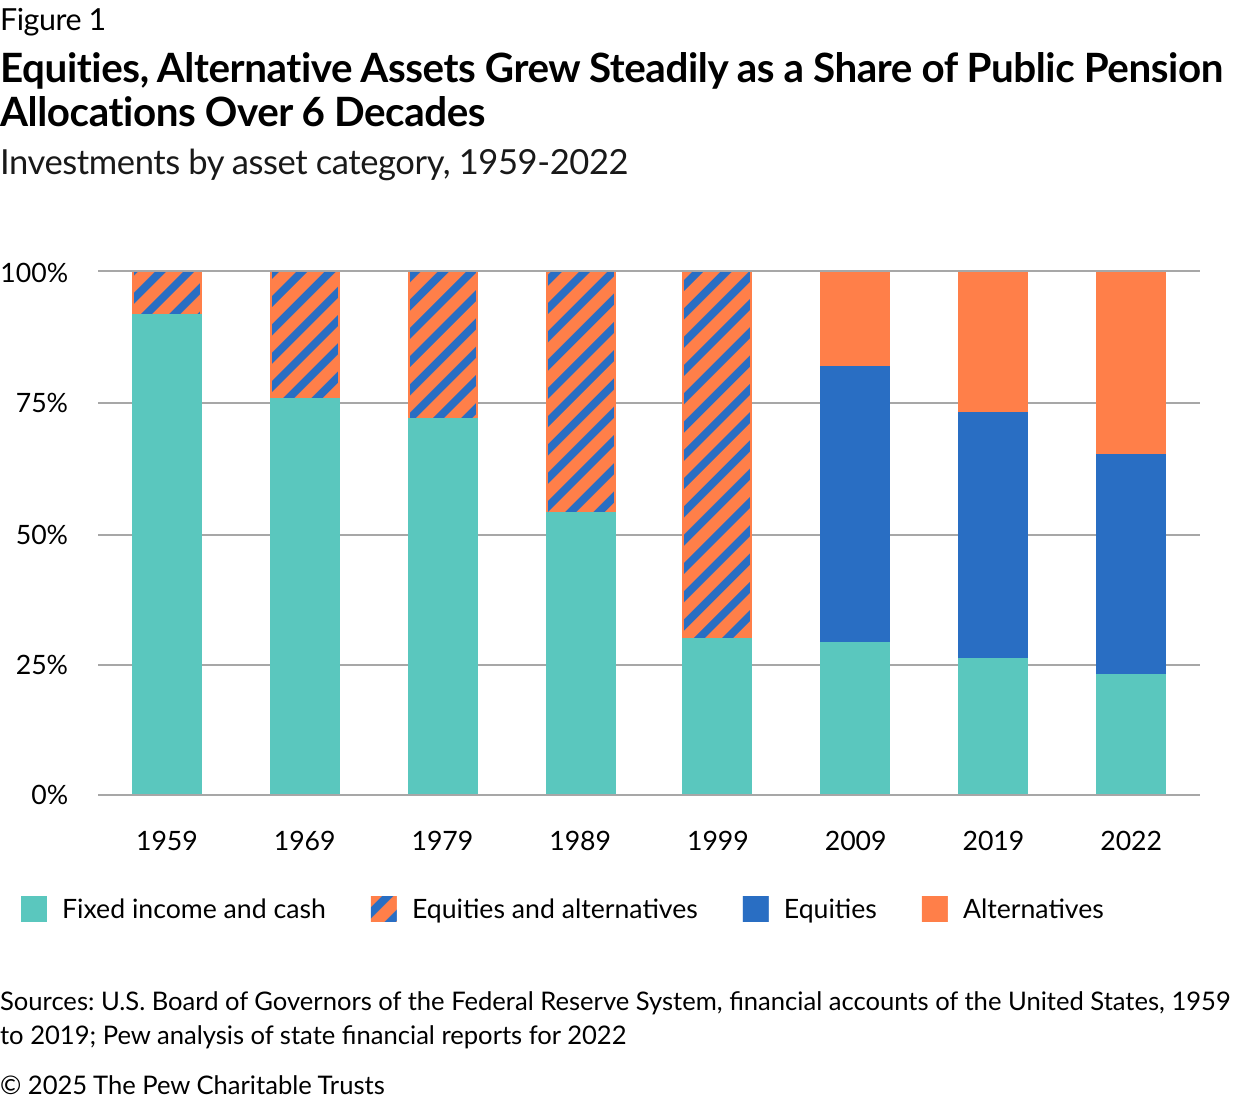
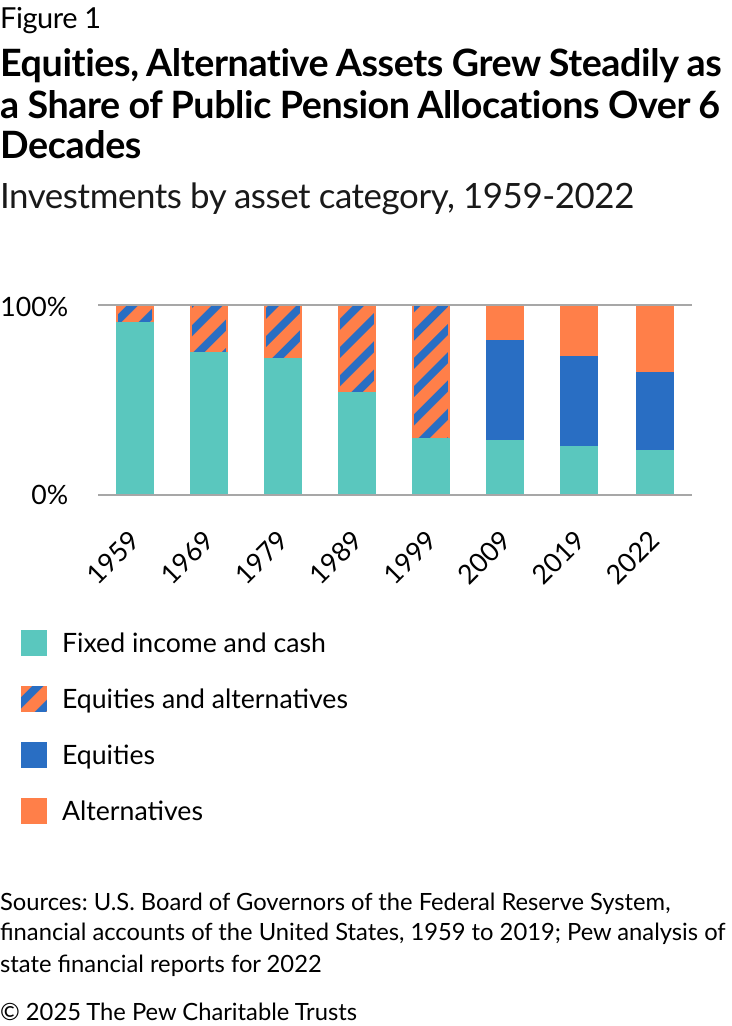
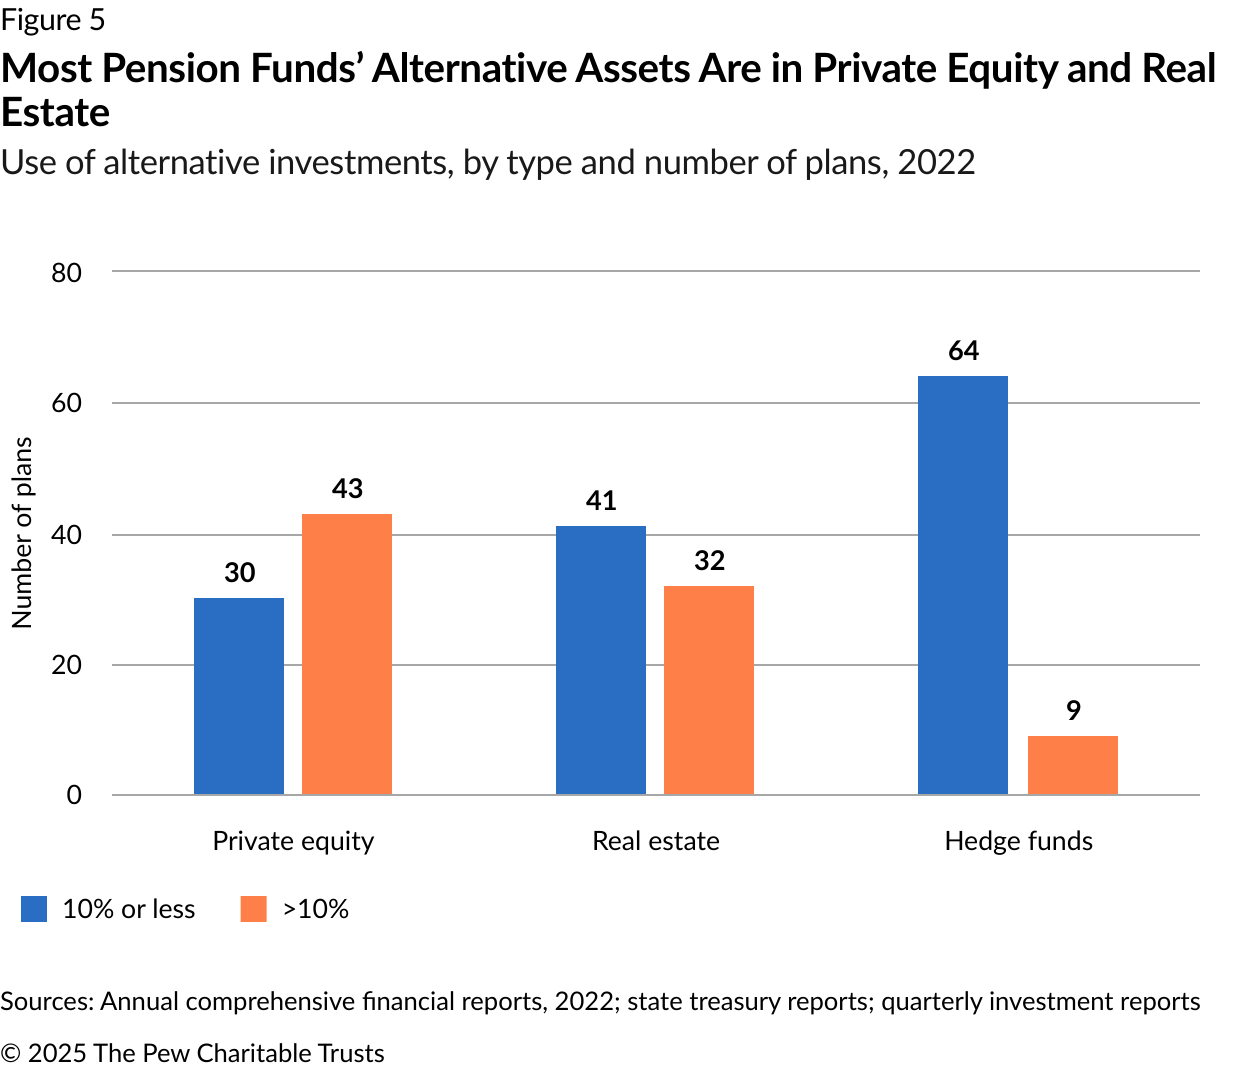
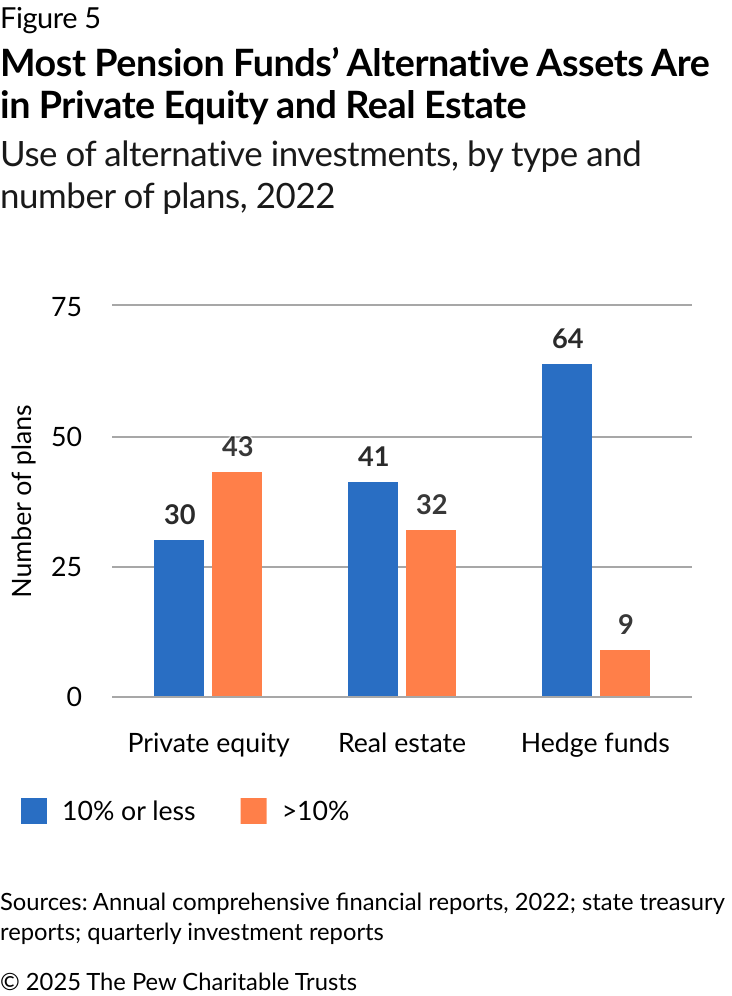
Pension plans have increased their investments in alternative asset classes to diversify their portfolios, which can reduce risk, and to pursue higher returns. Alternative investments offer higher yields than standard stocks and bonds, and because they tend to move independently of other markets, they may perform well even when traditional assets decline.1
However, despite helping to diversify portfolios and enhance prospects for returns, adding alternative asset classes often leads to greater complexity, cost, and volatility compared with traditional investments.
Consistent with this trend, pension plans are increasingly turning to private credit investment, a fast-growing segment within alternative assets. The California Public Employees’ Retirement System, for instance, directed 5% to private debt as of 2022.2
In contrast, the share of equities across major public pension plans has consistently decreased, dropping from more than 53% to approximately 42% over that span.
Most States’ 2022 Pension Fund Investment Returns Were Below Zero
Retirement system performance by state, 2022
Map of the United States showing states by investment returns, using four ranges: below -5% in green, -5% to less than 0% in orange, 0% to less than 5% in dark blue, and 5% or more in light blue. All states are either orange or dark blue, except Oregon, and Washington, which are light blue, and Arkansas, Hawaii, Idaho, Maine, New York, and Virginia, in green.
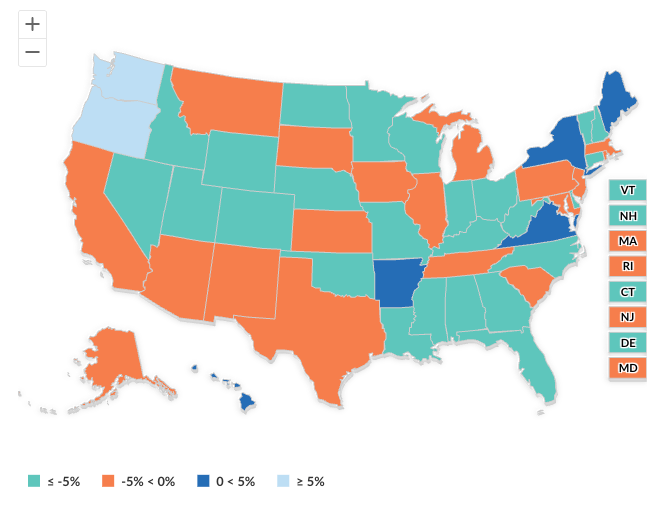
Note: Pension plans across states have varying fiscal year-end dates. For example, some states may report returns through June, while others might use a March cutoff. This variation may influence observed outcomes.
Sources: Annual comprehensive financial reports, 2022; state treasury reports; quarterly investment reports; and plan responses to data inquiries
© 2025 The Pew Charitable Trusts View image View image
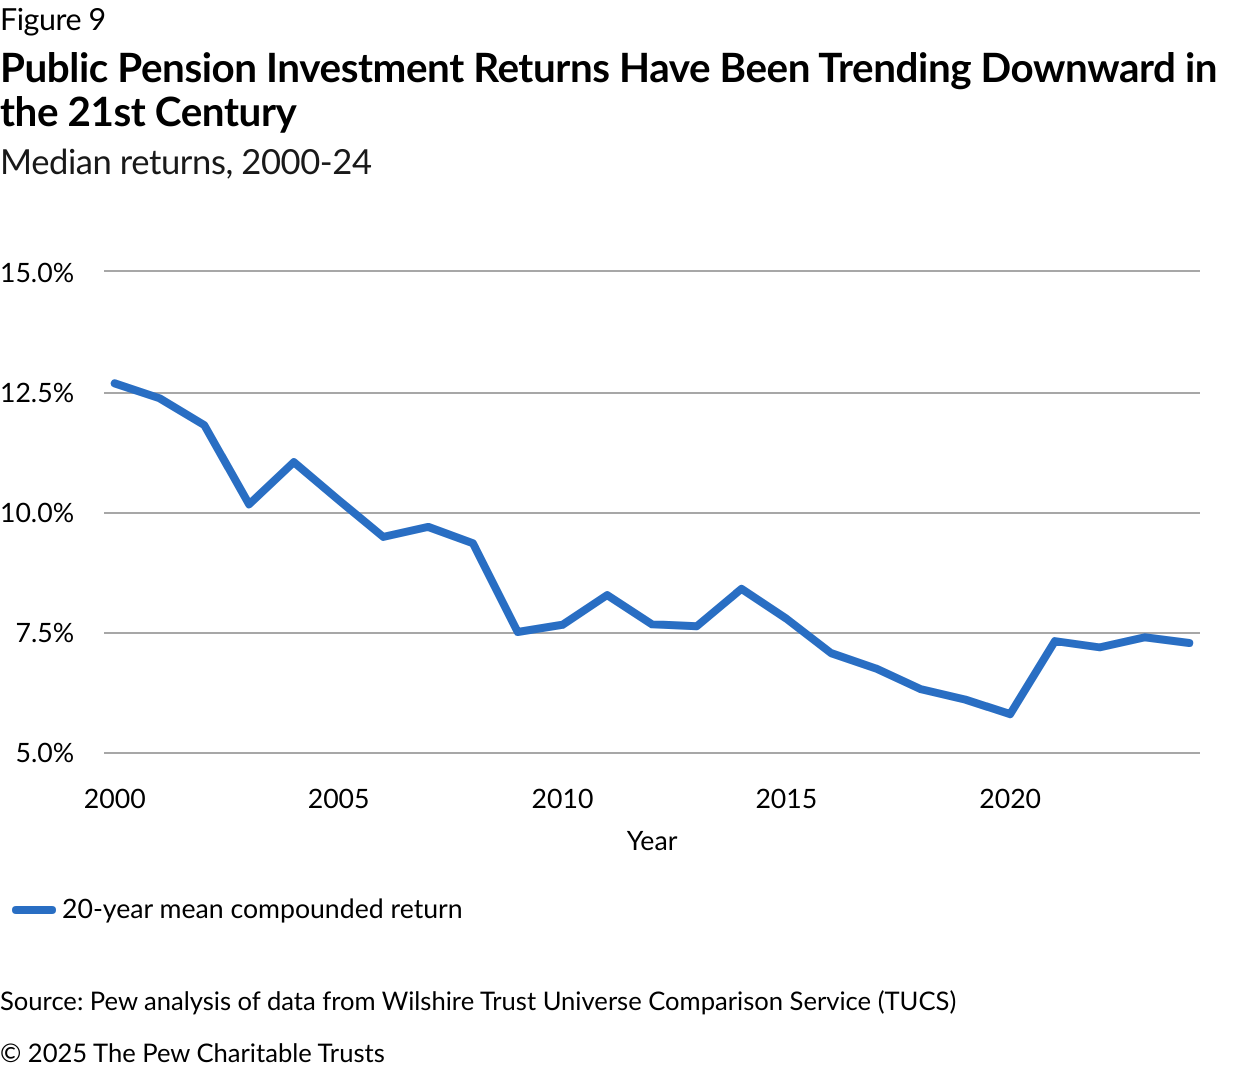
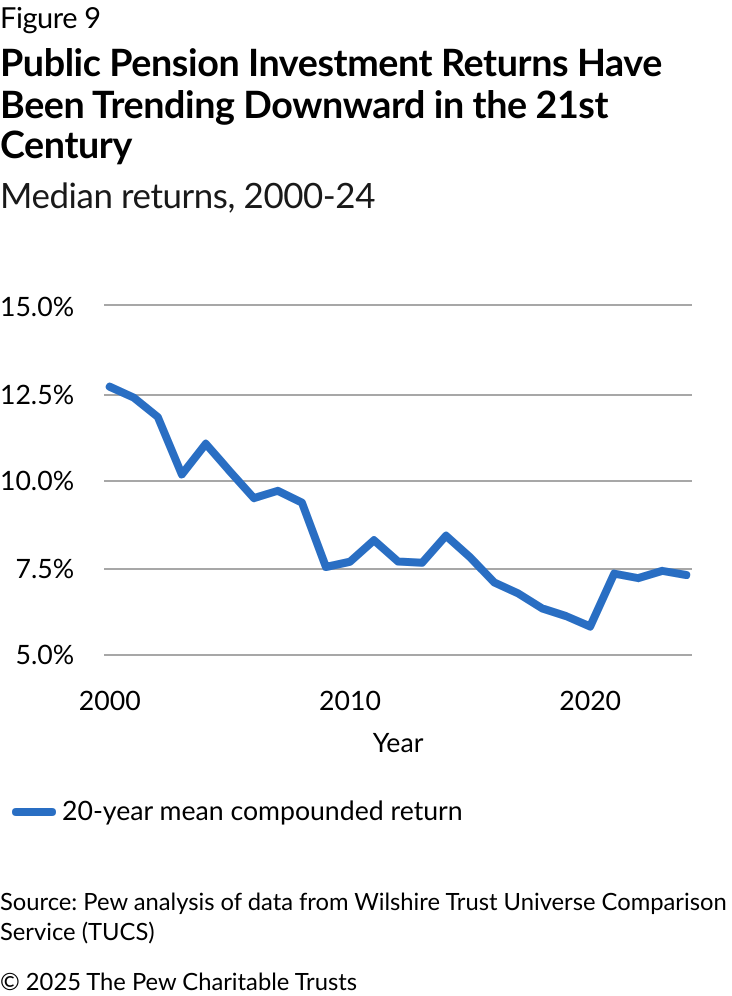
However, this long-term trend has been slowing. The market’s resilience, particularly the swift recovery from the pandemic downturn, has contributed to an apparent stabilizing of returns around the 7% mark since 2021.
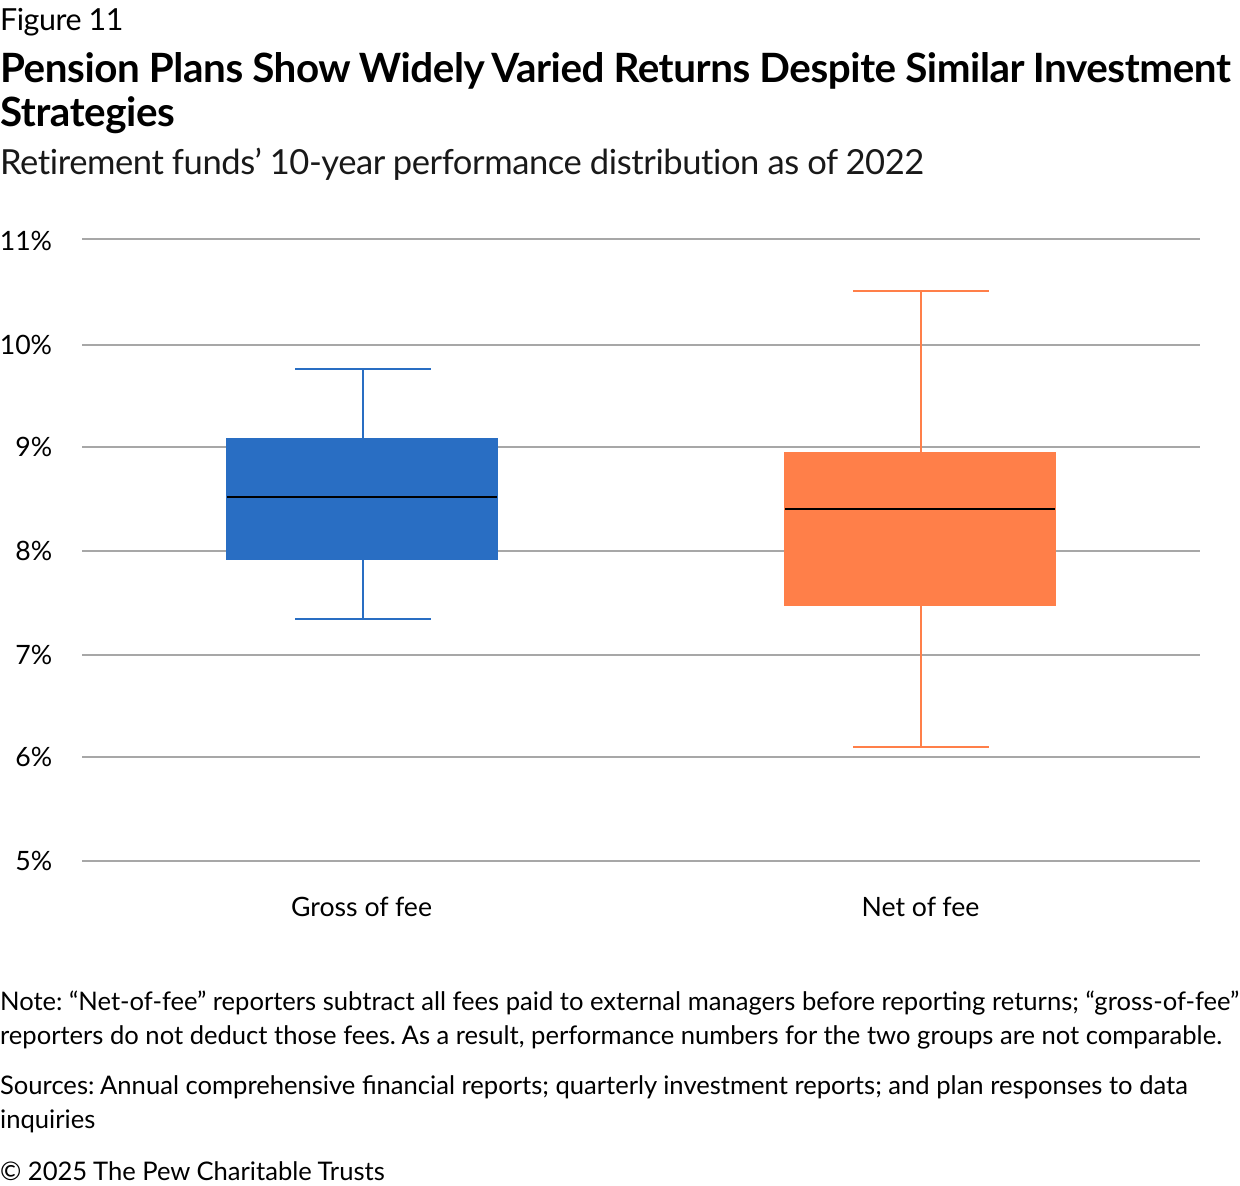
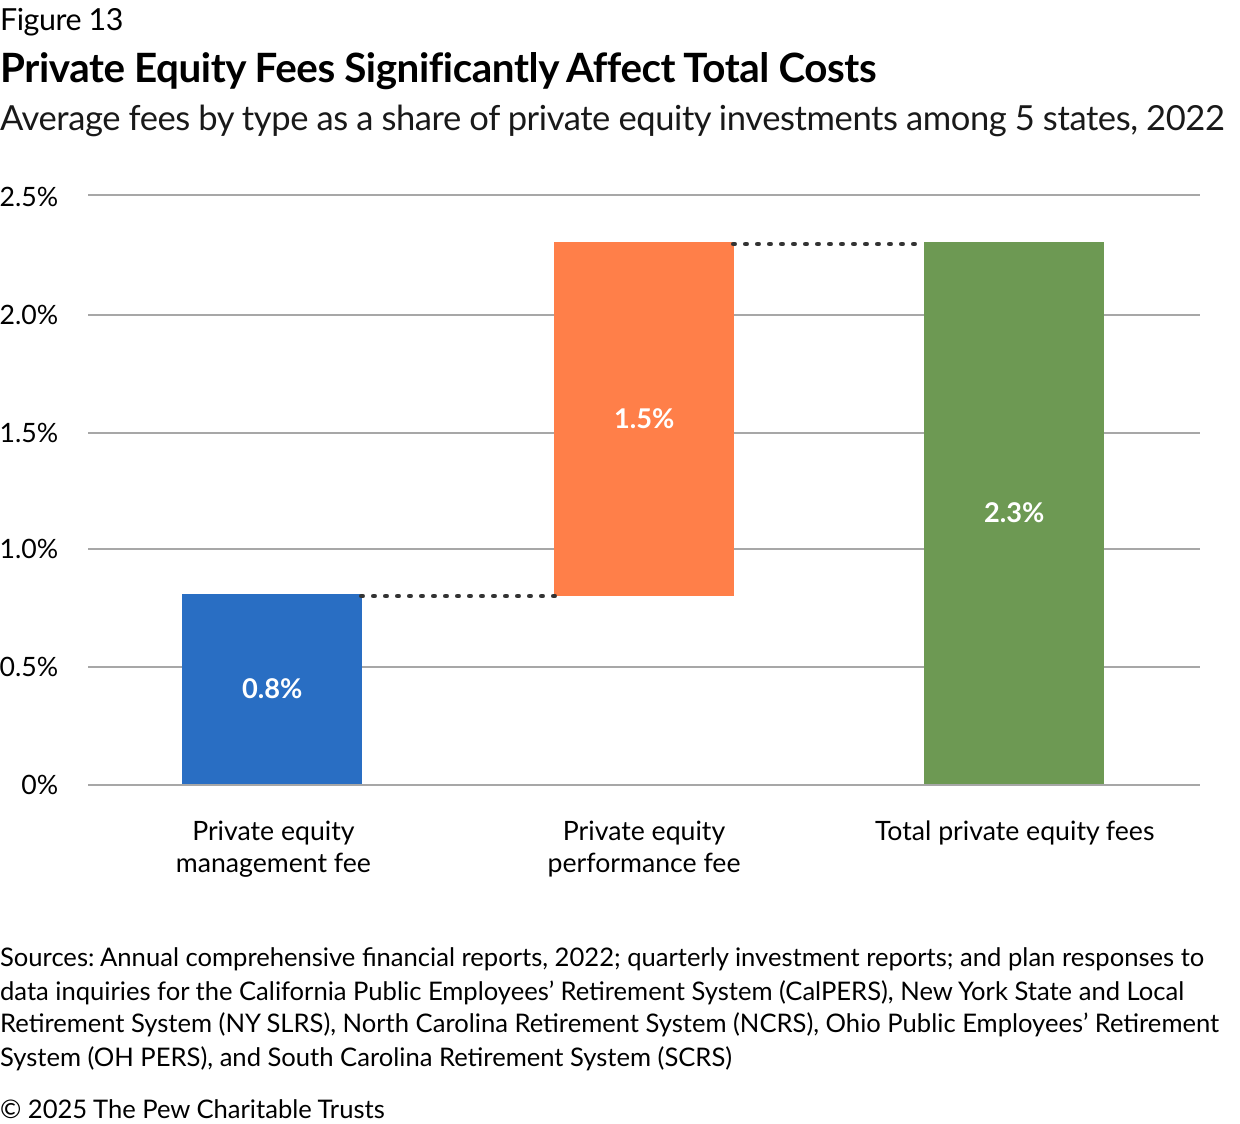
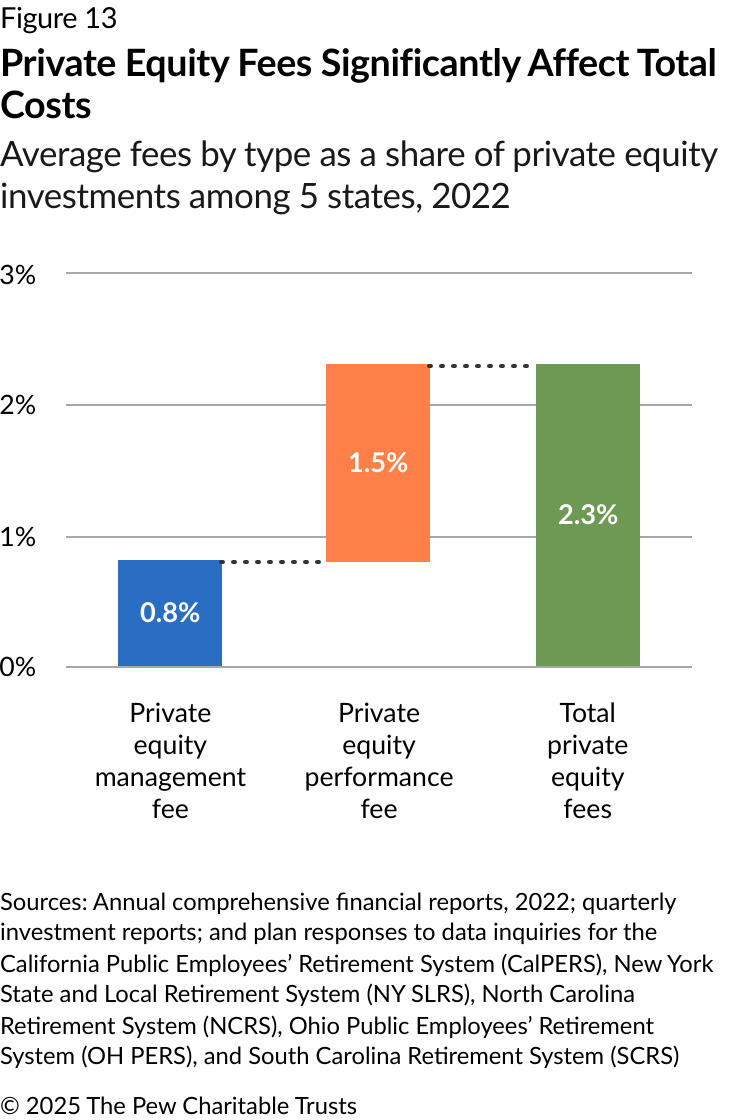
The combined private equity fees for five major pension plans that disclose them exceeded 2.3% of those plans’ total private equity investments, or more than $2.7 billion in 2022. Of that total, performance fees alone amounted to $1.7 billion, or 1.5% of the total investments, a far greater share than the mere 0.35% in total fund management fees that plans reported for that same year.
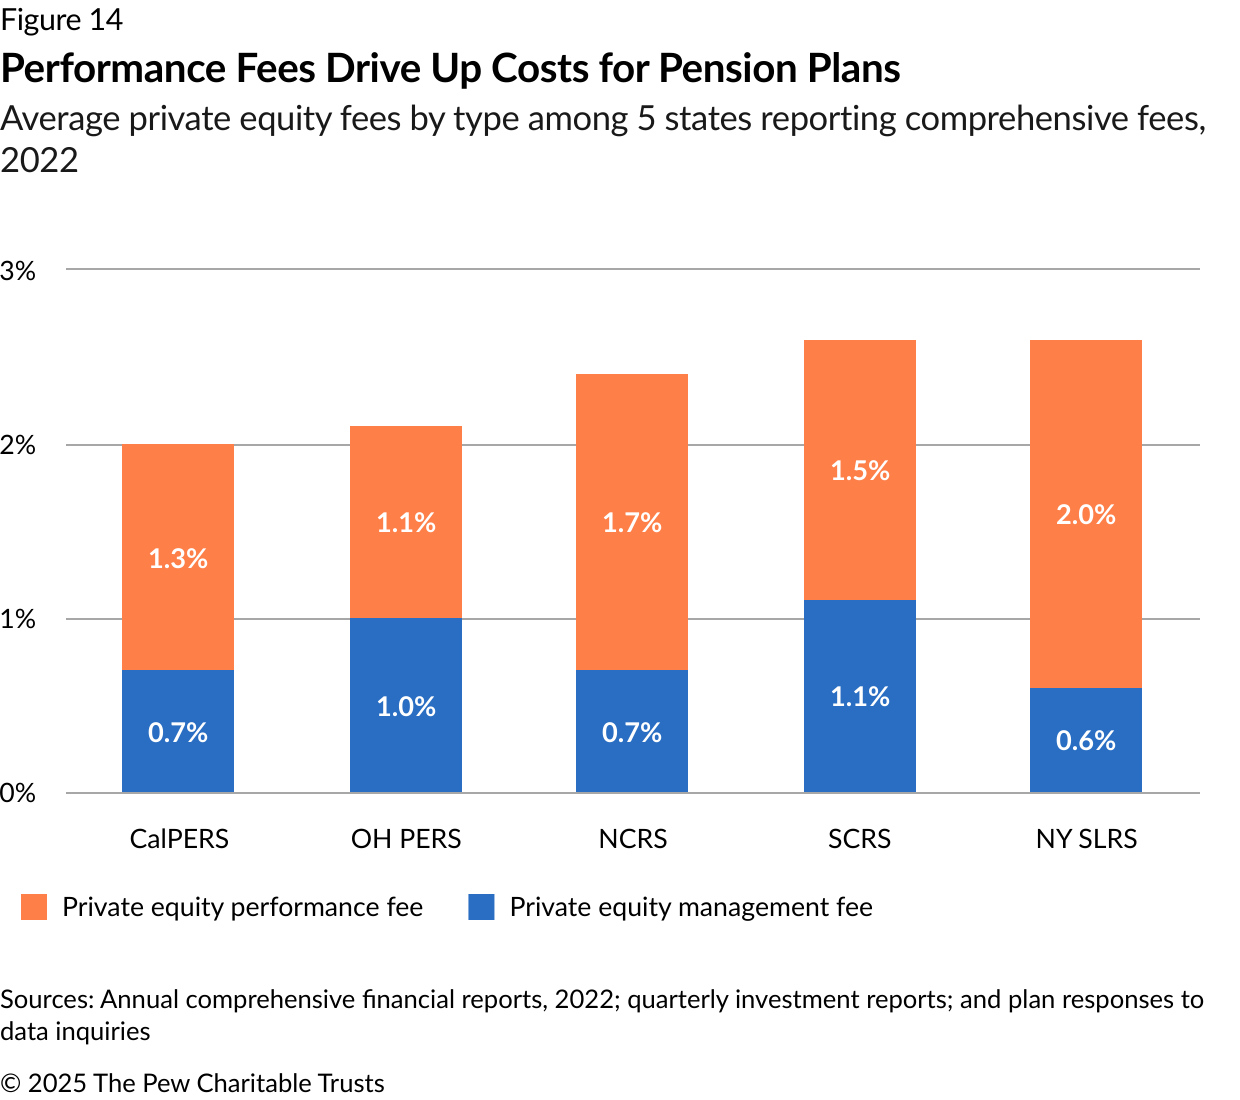

Accurate reporting of performance as well as management fees is critical for assessing the true cost of managing public pension plan investments, especially as many funds increasingly turn to alternative assets, such as private equity and real estate.
Endnotes
- Traditional investments are more accessible and liquid than alternative assets and are traded in public markets. In contrast, alternative investments, which encompass a range of assets, including private equity, real estate, hedge funds, infrastructure, and commodities, may not be commonly understood or accessible to most individual investors.
- Shruti Singh, “Private Credit Attracts Billions From U.S. Pension Plans,” Bloomberg News, 2023, https://www.bloomberg.com/news/articles/2023-12-18/calpers-other-us-public-pensions-pump-billions-into-private-credit.
- Actuarial Standard of Practice (ASOP) 27 provides guidance on selecting economic assumptions for use in measuring pension obligations and emphasizes that actuarial assumptions should be reasonable, as outlined in subsection 3.6, and should follow specific criteria, including: current and projected interest rates, current and expected inflation rates, historical and forecasted returns for various asset classes, and a fund’s historical performance. See Selection of Economic Assumptions for Measuring Pension Obligations, ASOP No. 27, Actuarial Standards Board, 2011, https://www.actuarialstandardsboard.org/asops/selection-economic-assumptions-measuring-pension-obligations-2/.


