Utah Takes Steps to Diversify Its Energy Mix
State energy and emissions profile

Overview
Renewable energy generation in Utah is slowly increasing as the state closes in on the goal it set in 2008 of reaching 20% renewable energy by 2025. And carbon emissions in the state have generally trended downward since 2006.1
Although coal and natural gas still make up most of Utah’s energy mix, the state is undertaking a range of efforts to expand its renewable energy portfolio and support electrification. These include adding electric vehicles (EVs) to the government fleet, building more EV charging infrastructure, and pioneering the advancement of geothermal resources.
As Utah’s electricity consumption continues to increase, driven by robust population and economic growth, its strong renewable energy generation potential can help the state meet those needs and address pollution.
Utah’s energy mix
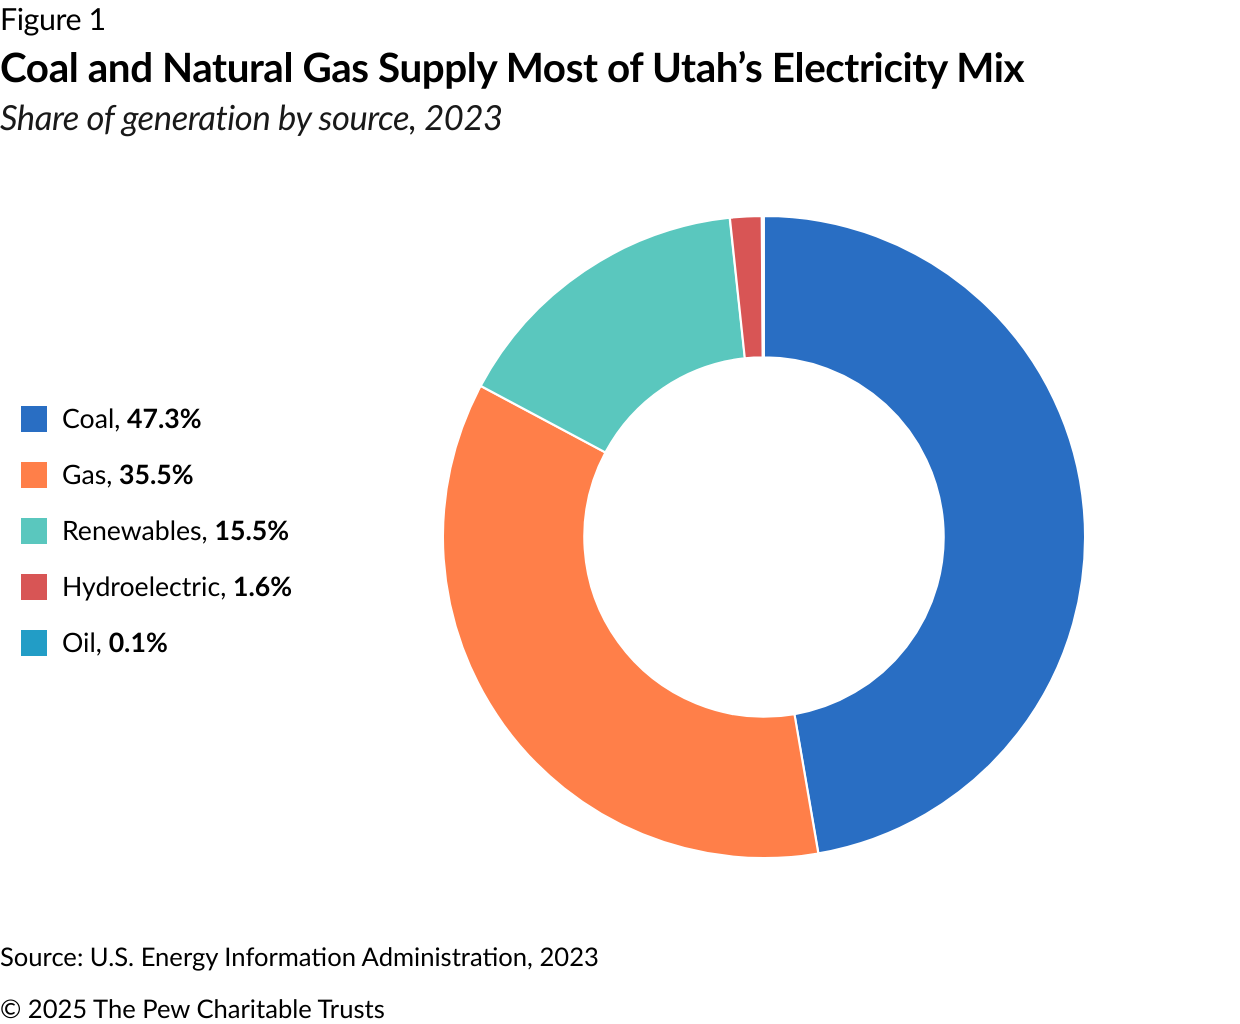
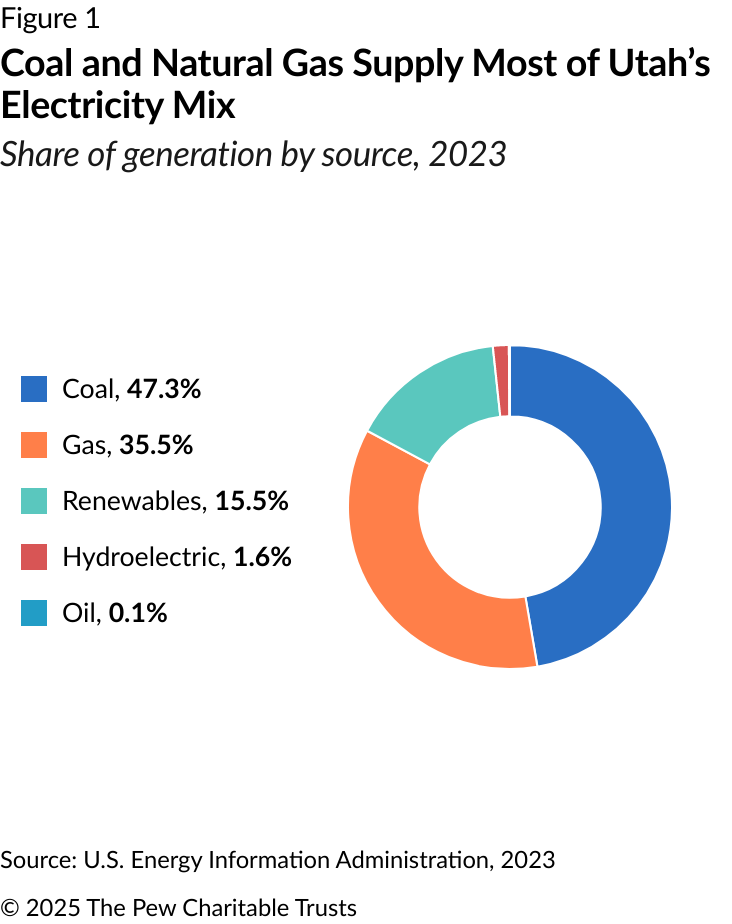
For decades, Utah has been a net exporter of energy, but in recent years a growing share of its electric generation has been used in-state.2 The state produces nearly 85% of its energy from fossil fuels, mainly coal and natural gas, with the balance coming from solar, wind, and other renewables. (See Figure 1.)
Natural gas generation is on the rise in the state, accounting for 35.5% of all electricity generated in 2023, an increase of 7.2% from a year earlier.3 But coal generation is declining. It made up 47.3% of Utah’s net electric generation in 2023—down 27.7% from 2015 levels.4 The state does not generate any nuclear energy; a proposed modular reactor project was canceled in 2023 over concerns about mounting costs.5
Among the state’s major sectors, in 2022, the commercial sector used the most electricity (38.6%), followed by residential (34%), industrial (27.3%), and transportation (0.1%).6
Renewable energy
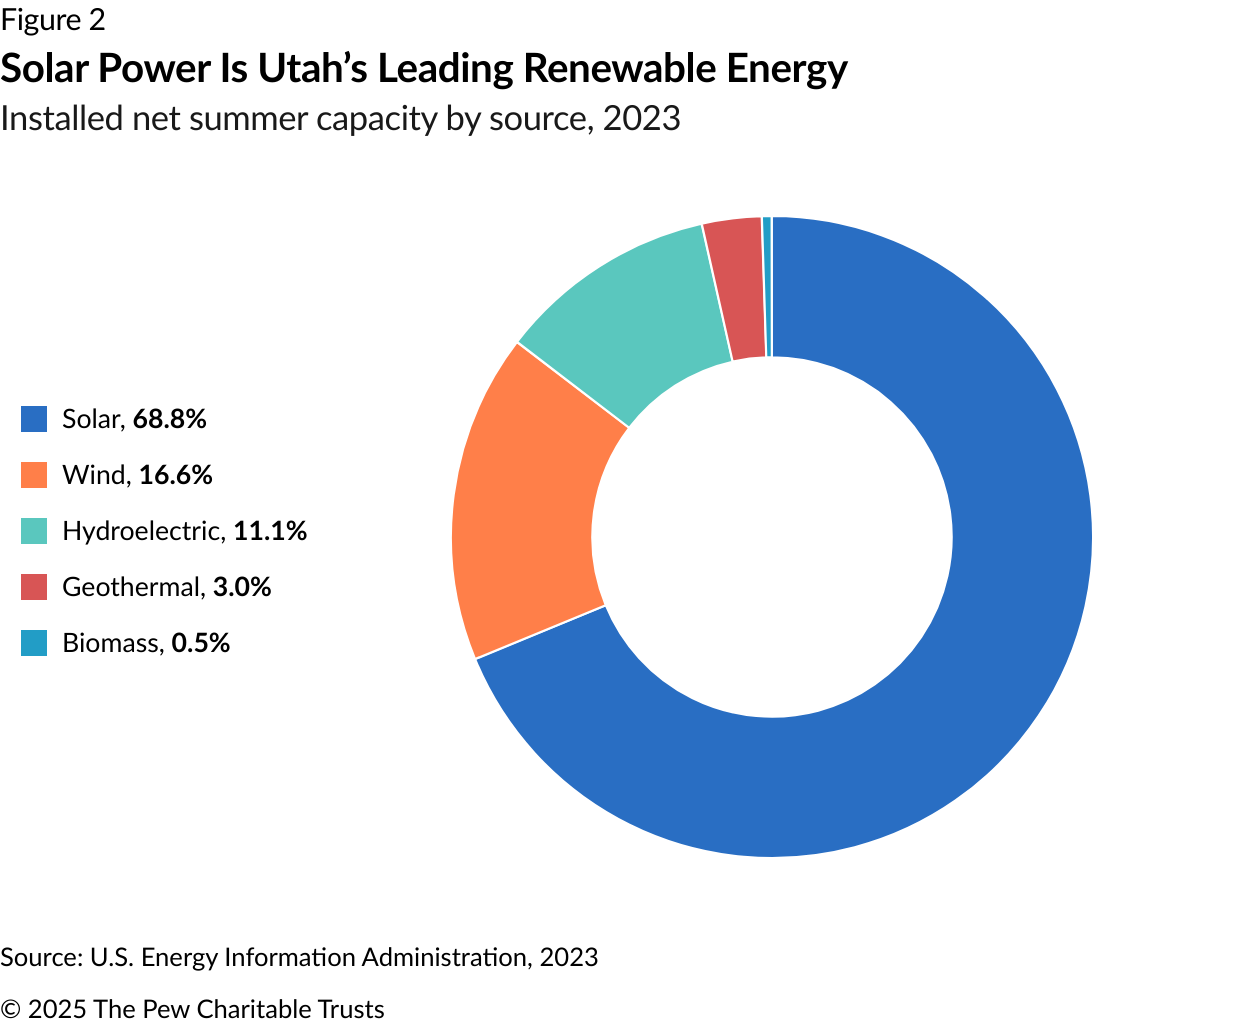
In Utah, 15.5% of all utility-scale electric power generated in 2023 came from renewable energy sources, up from 13% in 2022.7 Most of the state’s renewable generation comes from solar, wind, and hydroelectric. (See Figure 2.)
Utah ranks 13th in the nation for solar with 3,110 megawatts (MW) of total installed capacity as of early 2024, enough to power 586,000 homes. And the state has even greater solar potential: The Solar Energy Industries Association projects that Utah will install an additional 5,600 MW by 2029.8
Although geothermal generation is still an emerging industry, Utah ranks third highest in the U.S. for this type of production, with three facilities providing 72 MW of energy as of 2023 and additional large-scale resources being explored.9
Utah has 391 MW of installed wind capacity, but a 2009 study indicated a potential for 9,145 MW of capacity across 24 of the state’s 29 counties.10

Emissions and air quality
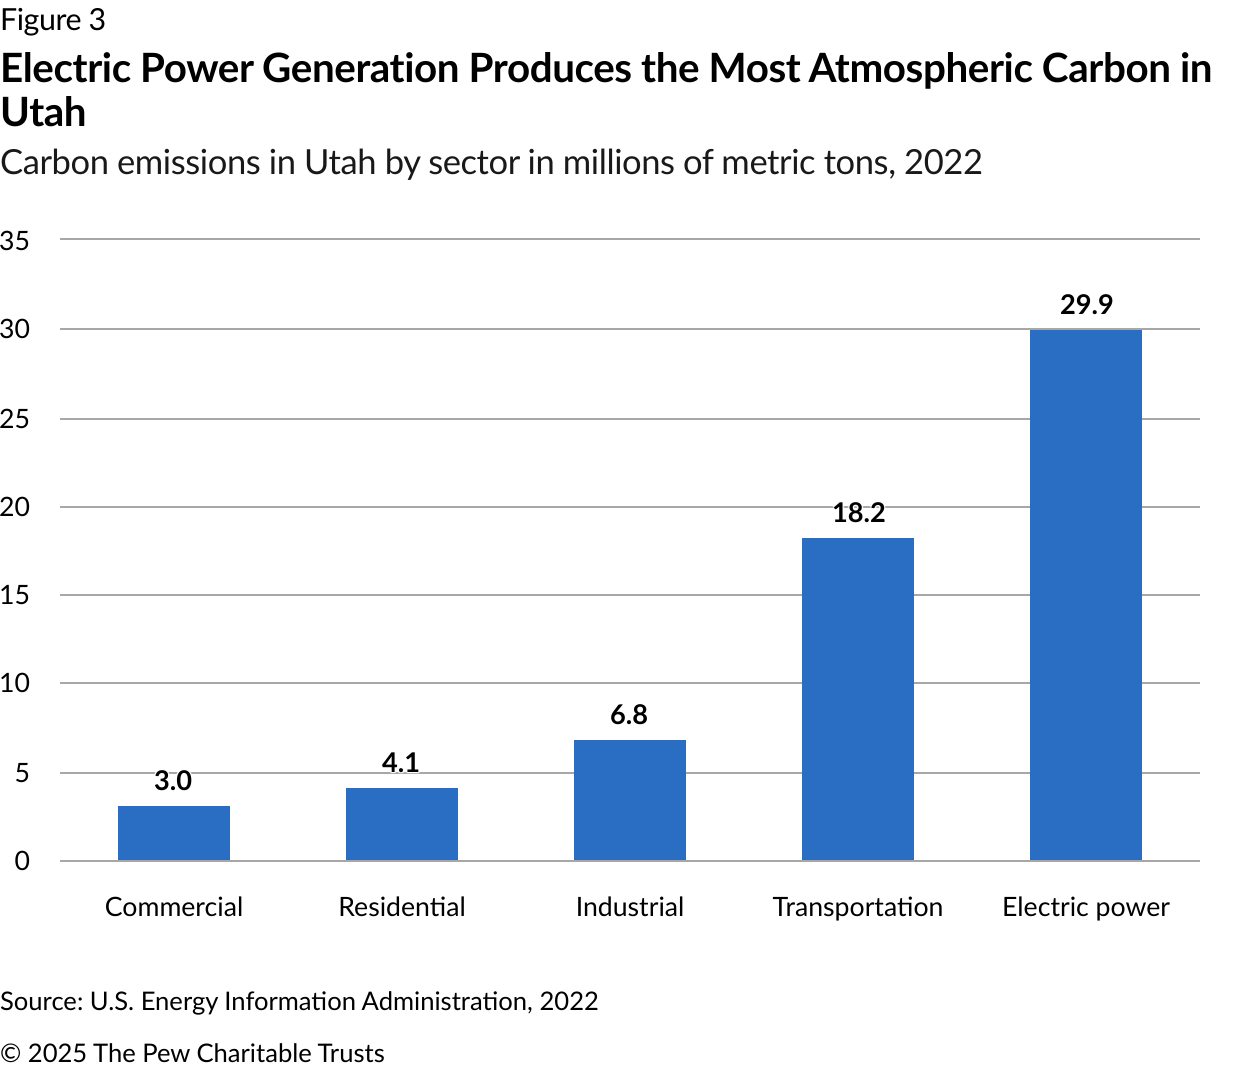
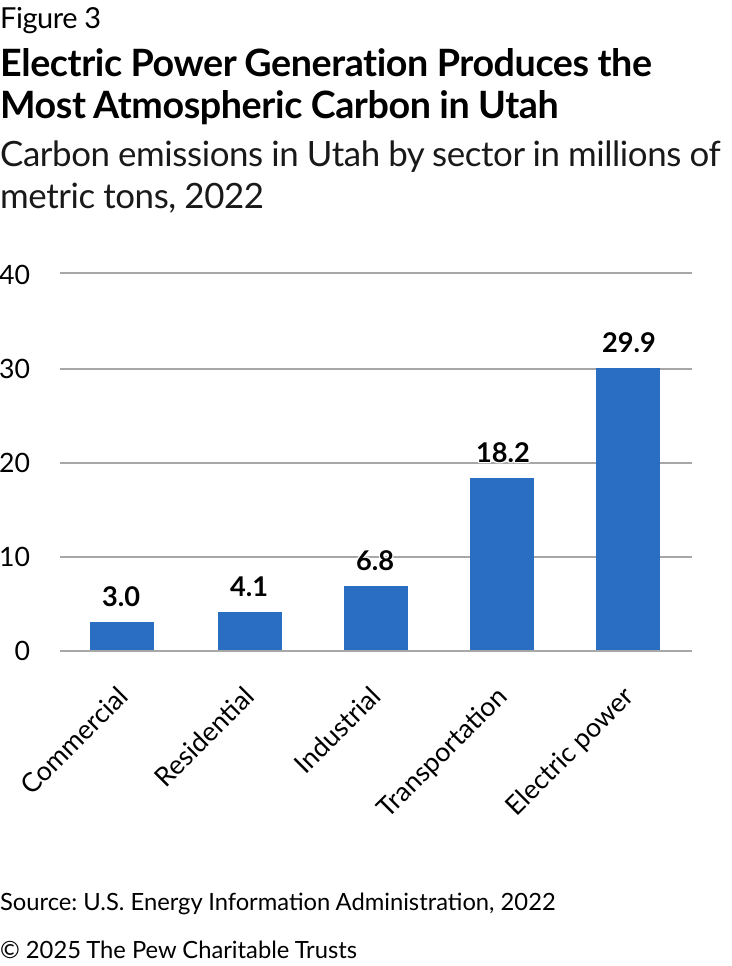
Carbon dioxide emissions from the burning of fossil fuels in the electric power and transportation sectors are the leading contributors to global warming. In 2021, Utah had the 31st-lowest total carbon emissions among the 50 states and Washington, D.C., but ranked 20th in the nation for per capita emissions, of which 44% came from the electric power sector and 32% from the transportation sector.11 (See Figure 3.)
Utah has also long dealt with air quality issues, especially related to ozone and fine particulate matter (PM2.5), which have implications for cardiovascular and respiratory health. Ozone is formed when pollutants, emitted by cars, power plants, and other sources, react with sunlight. PM2.5 is the result of various chemical reactions, including the burning of fossil fuels at power plants and factories and combustion from gas-powered vehicles. The state’s sprawling mountain ranges exacerbate the problem, trapping pollutants in populated valleys.
As of the end of 2023, the U.S. Environmental Protection Agency (EPA) designated Utah’s Wasatch Front and Uinta Basin regions as “nonattainment” areas—that is, places that are out of compliance with federal pollution limits—because they persistently exceeded the National Ambient Air Quality Standard for ozone.12
The EPA also designated Provo and Salt Lake City, which both struggle with transportation and other emissions driven pollution, as nonattainment areas for PM2.5 in April 2024.13 But in the state’s capital city, the surrounding Salt Lake Valley’s distinctive terrain is an added factor, creating periods of inversion—when cold air gets trapped under warmer air—during the winter months, elevating PM2.5 levels. Further, dust from evaporation of the Great Salt Lake also exacerbates these air quality challenges.
States with regions categorized as nonattainment have three years to submit and implement a plan to lower emissions.14

Energy governance
A collection of public and private utility companies manage and operate Utah’s electricity grid, with most of the electricity provided by Rocky Mountain Power, a subsidiary of PacifiCorp and the state’s only regulated utility.15 The rest of Utah’s electric power is generated by electric cooperatives, municipal utilities, power agencies, and an interlocal utility company. (See Figure 4.)
Regional transmission organizations (RTOs) or independent system operators (ISOs)—entities that help coordinate electric power systems across states and regions—manage 60% of electric power nationwide. As of 2024, neither Utah nor any of its electric utilities are members of an RTO or ISO. However, PacifiCorp has committed to participating in the California ISO’s regional electricity market beginning in 2026.16
The Utah Public Service Commission, which is made up of three commissioners appointed by the governor and approved by the state Senate, regulates Rocky Mountain Power and presides over ratemaking.

Endnotes
- “Table 1. State Energy-Related Carbon Dioxide Emissions by Year (1970-2021),” U.S. Energy Information Administration, 2023, https://www.eia.gov/environment/emissions/state/.
- Michael D. Vanden Berg, “Utah’s Energy Sector in 2023 and Outlook for 2024,” Kem C. Gardner Policy Institute at The University of Utah, March 2024, https://d36oiwf74r1rap.cloudfront.net/wp-content/uploads/2024/03/Energy-RB-Mar2024.pdf.
- “Net Generation for All Sectors (Thousands Megawatt Hours)—Utah,” U.S. Energy Information Administration, https://www.eia.gov/electricity/data/browser/#/topic/0?agg=2,0,1&fuel=de&geo=00000000000g&sec=g&freq=A&start=2001&end=2023&ctype=linechart<ype=pin&rtype=s&maptype=0&rse=0&pin=.
- “Utah: State Profile and Energy Estimates—Profile Analysis,” U.S. Energy Information Administration, June 20, 2024, https://www.eia.gov/state/analysis.php?sid=UT.
- Timothy Gardner and Manas Mishra, “NuScale Ends Utah Project, in Blow to U.S. Nuclear Power Ambitions,” Reuters, Nov. 9, 2023, https://www.reuters.com/business/energy/nuscale-power-uamps-agree-terminate-nuclear-project-2023-11-08/.
- “Retail Sales of Electricity to Ultimate Customers—Annual, by Sector, by State, by Provider,” U.S. Energy Information Administration, Oct. 5, 2023, https://www.eia.gov/electricity/data.php#sales.
- “Net Generation for Electric Utility (Thousand Megawatt Hours)—Utah,” U.S. Energy Information Administration, 2023, https://www.eia.gov/electricity/data/browser/#/topic/0?agg=2,0,1&fuel=vvg&geo=00000000000g&sec=8&linechart=ELEC.GEN.ALL-UT1.A&columnchart=ELEC.GEN.ALL-UT-1.A&map=ELEC.GEN.ALL-UT-1.A&freq=A&ctype=linechart<ype=pin&rtype=s&pin=&rse=0&maptype=0.
- Solar Energy Industries Association, “State Solar Spotlight: Utah,” September 2024, https://seia.org/wp-content/uploads/2024/08/Utah-1.pdf.
- “Geothermal Explained: Use of Geothermal Energy,” U.S. Energy Information Administration, April 3, 2024, https://www.eia.gov/energyexplained/geothermal/use-of-geothermal-energy.php. Fervo Energy, “Fervo Energy Announces 320 MW Power Purchase Agreements With Southern California Edison,” news release, June 25, 2024, https://fervoenergy.com/fervo-energy-announces-320-mw-power-purchase-agreements-with-southern-california-edison/.
- “Wind Energy in Utah,” U.S. Department of Energy, WindExchange, https://windexchange.energy.gov/states/ut. “Energy News: Utah’s Renewable Energy Zone Assessment,” Jason Berry, Utah Geological Survey, May 2009, https://geology.utah.gov/map-pub/survey-notes/energy-news/energy-news-utahs-renewable-energy-zone-assessment/.
- “Rankings: Total Carbon Dioxide Emissions, 2022 (Million Metric Tons),” U.S. Energy Information Administration, 2022, https://www.eia.gov/state/rankings/?sid=US#/series/226.
- “Ozone: EPA Designates Marginal Nonattainment Areas in Utah,” Utah Department of Environmental Quality, Dec. 22, 2023, https://deq.utah.gov/communication/news/ozone-marginal-nonattainment-areas-utah.
- “Area Designations: PM2.5 State Implementation Plan Development,” Utah Department of Environmental Quality, April 2, 2024, https://deq.utah.gov/air-quality/area-designations-pm2-5-state-implementation-plan-development.
- American Lung Association, “What Does Ozone Nonattainment Really Mean?,” September 2017, https://www.lung.org/getmedia/49cf5fa5-8798-4eba-86da-55d166b9655c/what-does-ozone-nonattainment-really-mean.
- “Electric Utilities,” Utah Office of Consumer Services, https://ocs.utah.gov/learn-about-your-service-provider/electric-utilities/.
- PacifiCorp and California ISO, “PacifiCorp Formally Commits to California ISO’s EDAM,” news release, April 26, 2024, https://www.caiso.com/documents/pacificorp-formally-commits-to-california-isos-edam.pdf.

ADDITIONAL RESOURCES

Article


