Pennsylvania’s Lack of Building Has Contributed to Housing Shortage, Hurt Affordability
Elsewhere, reforms have added homes, improved affordability

Overview
Housing costs rise when there are not enough homes to meet demand. Pennsylvania, in part because of restrictive zoning regulations, ranked 44th among the 50 states on rate of housing built from 2017 to 2023. The average rent in the 23 Pennsylvania counties tracked by Zillow’s rent estimate was $1,013 in 2017 and $1,476 in 2023, a 46% increase.1 That is much larger than the increase in wages and prices for other goods and services from 2017 to 2023.2
The increase in housing costs was most pronounced in parts of Pennsylvania that experienced a population increase but did not allow for construction of enough new homes to house the larger population. The 23 counties tracked by Zillow and analyzed in this report include Pennsylvania’s most populous cities and counties. The population in the 23 counties, combined, grew only 0.7% from 2017 to 2023, while in northeastern Pennsylvania it grew 1.7%, and in Philadelphia’s suburbs, the population increased 2.5%.3 Rent increases were greatest—as high as 81%—in northeastern Pennsylvania, where housing costs actually rose faster than in New York City (+30%) and its suburbs (+44%) from 2017 to 2023 (although rents in New York and New Jersey were still higher than in Pennsylvania as a whole), while housing production lagged behind demand.4
Rents also grew significantly in smaller metropolitan areas such as Lancaster, Reading, Harrisburg, and York, as well as the Philadelphia suburbs and parts of western Pennsylvania, many of which gained population faster than they provided additional housing.
Not only do residents have hundreds of dollars less to spend each month on groceries and other bills as a result of higher rents, but homeownership has been pushed further out of reach because not enough housing is being built. As the number of homes on the market across Pennsylvania has dropped by 60%, from 48,199 in January 2017 to just 19,361 in December 2023, the median price of homes has risen by 55% statewide, from $165,000 to $255,000. In northeastern Pennsylvania, it has increased by 73%.5
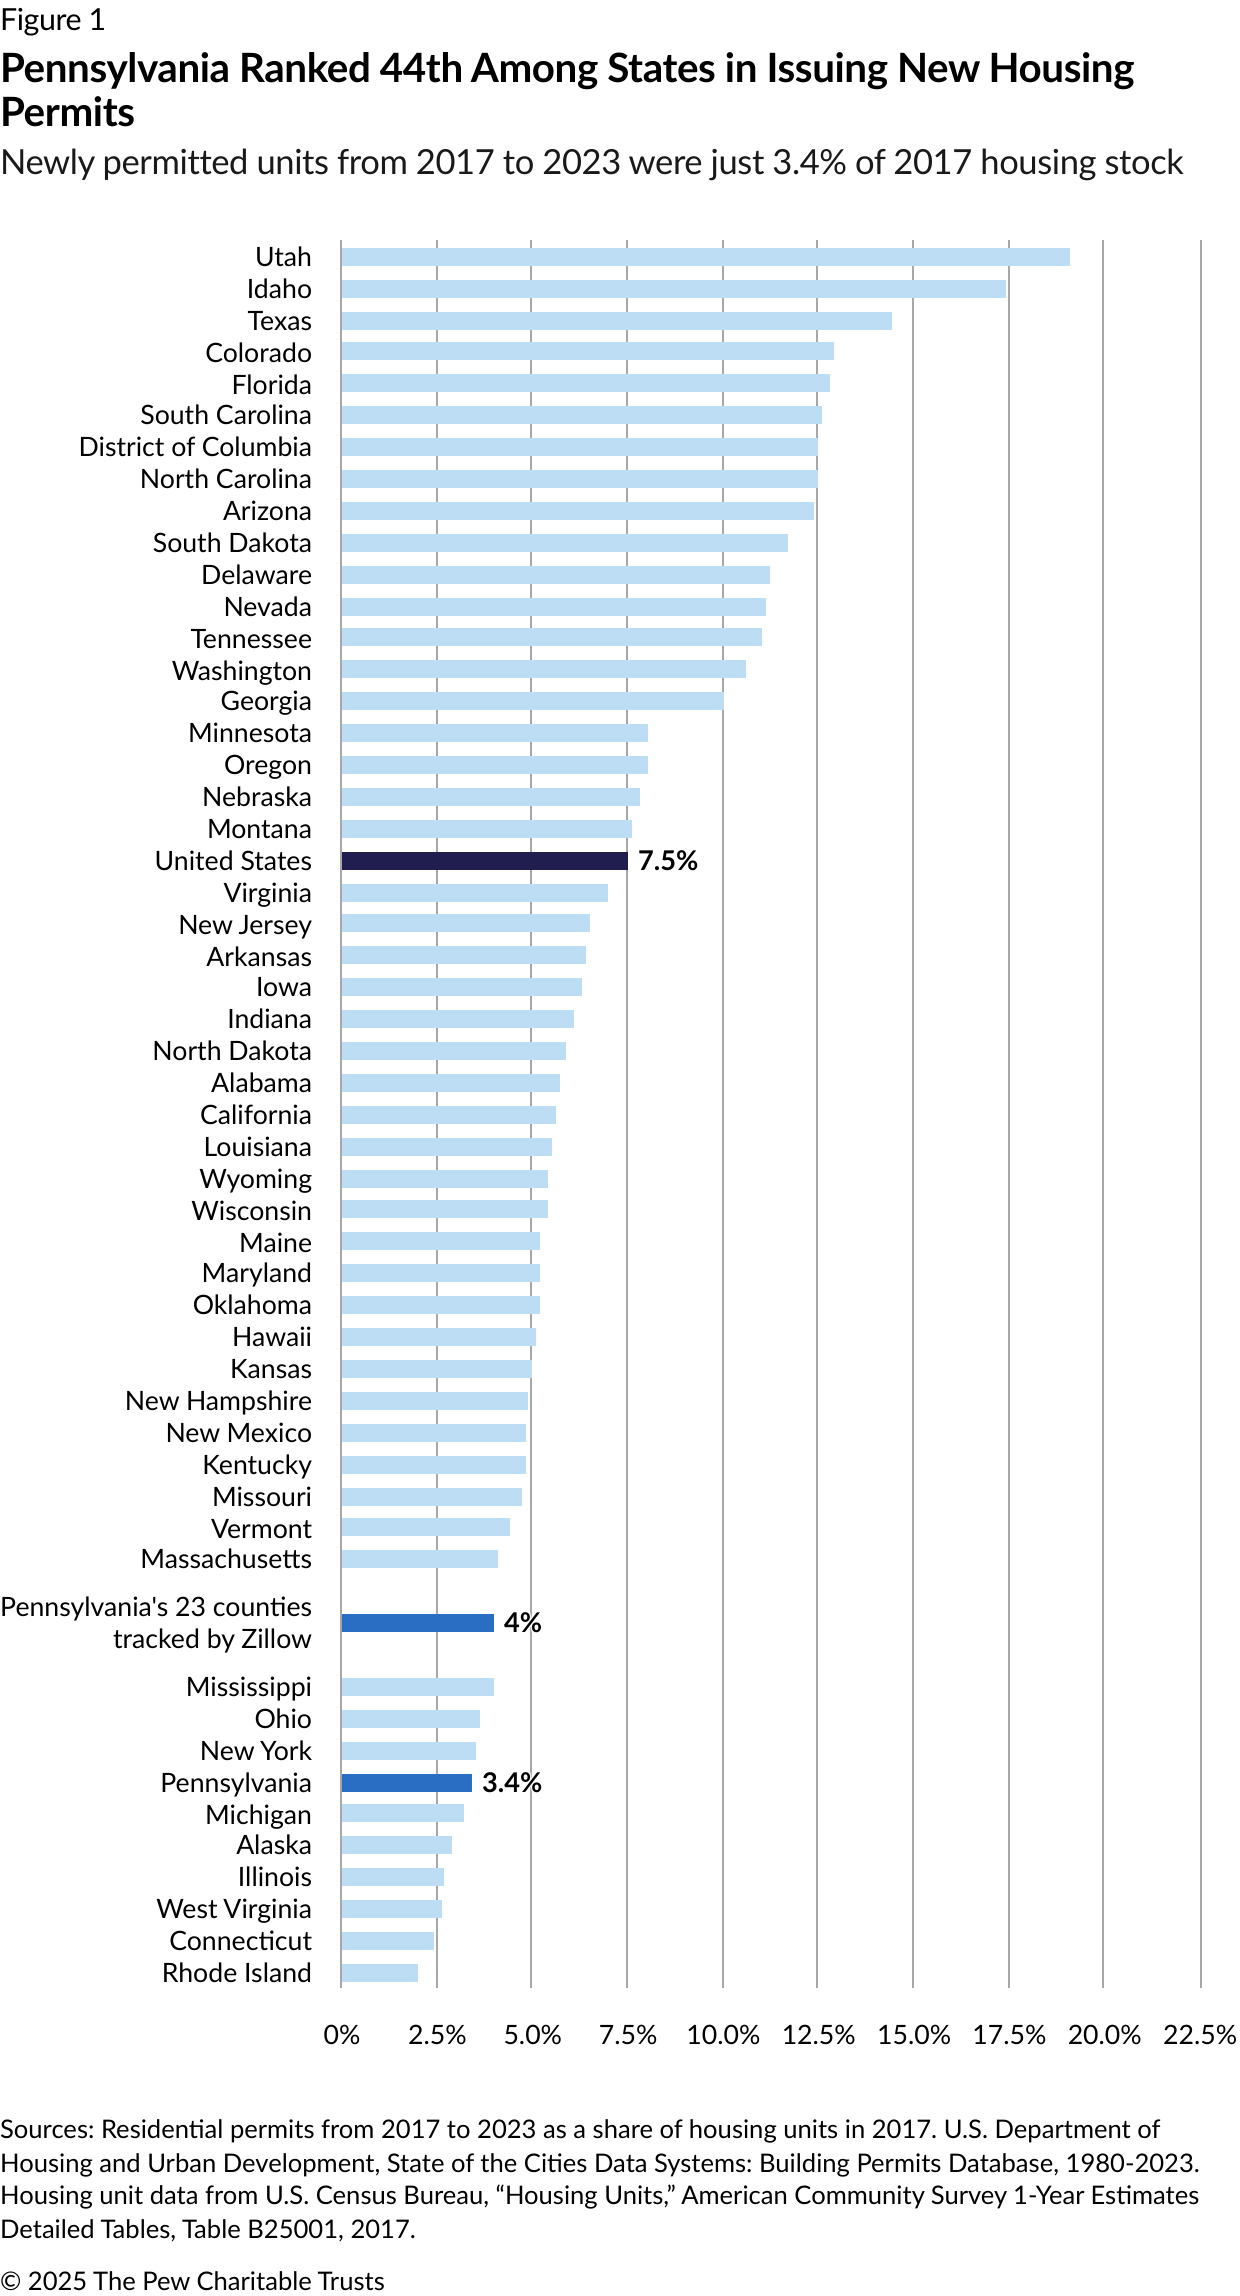
In Pennsylvania as in most of the United States, individual towns, cities, and counties issue and enforce most land use and zoning regulations. From 2017 to 2023, local governments issued building permits for only enough units to increase the state’s housing stock by 3.4%—well below the United States as a whole, which had a 7.5% increase during that seven-year period. Meanwhile, the number of households in Pennsylvania increased by 5.1%, which is above the increase in the housing stock. Fewer permits issued leads to fewer homes built—a major reason that rents have increased dramatically in Pennsylvania.
Pennsylvania also lagged behind the national average in adding lower-cost homes such as apartments, duplexes, and town houses, in large part because of zoning restrictions.6 Many localities around the state, for instance, allow only one single-family home to be built on land that could instead house more families. Other places have very large minimum lot sizes for new development, precluding efficient land use. Still others limit the viability of potentially more affordable types of housing, such as accessory dwelling units (smaller residential units, such as “granny flats” or garage apartments, built on a lot with a larger home).
The United States has a nationwide housing shortage. In order to address the deficiency in their states, state-level policymakers in Arizona, Colorado, Florida, Maryland, Montana, and Rhode Island have enacted legislation designed to increase housing supply statewide and stabilize costs. At the city level, Houston and Minneapolis provide examples of how increasing housing supply held down rent growth and improved affordability.
How Pennsylvania compares with other states
Pennsylvania ranks below almost all other states in recent new home construction. From 2017 to 2023, its communities issued enough building permits to increase the number of housing units in the state by just 3.4% compared with the number of units that existed in 2017. (Because some of those permits allowed for the replacement of existing homes, that does not mean the total number of units increased 3.4%.) In contrast, in the most prolific state, Utah, the number of permits issued from 2017 to 2023 equaled 19.1% of the state’s 2017 housing supply. Idaho and Texas ranked second and third, with building permits totaling 17.4% and 14.4% of the 2017 housing stock over this period. (See Figure 1.)
Only six states rank below Pennsylvania in the share of new units approved. Nor is this a recent trend: Pennsylvania has issued permits to add only 10% more homes since 2000, compared with a 25% increase nationally.7
Housing costs have risen the most in northeastern Pennsylvania
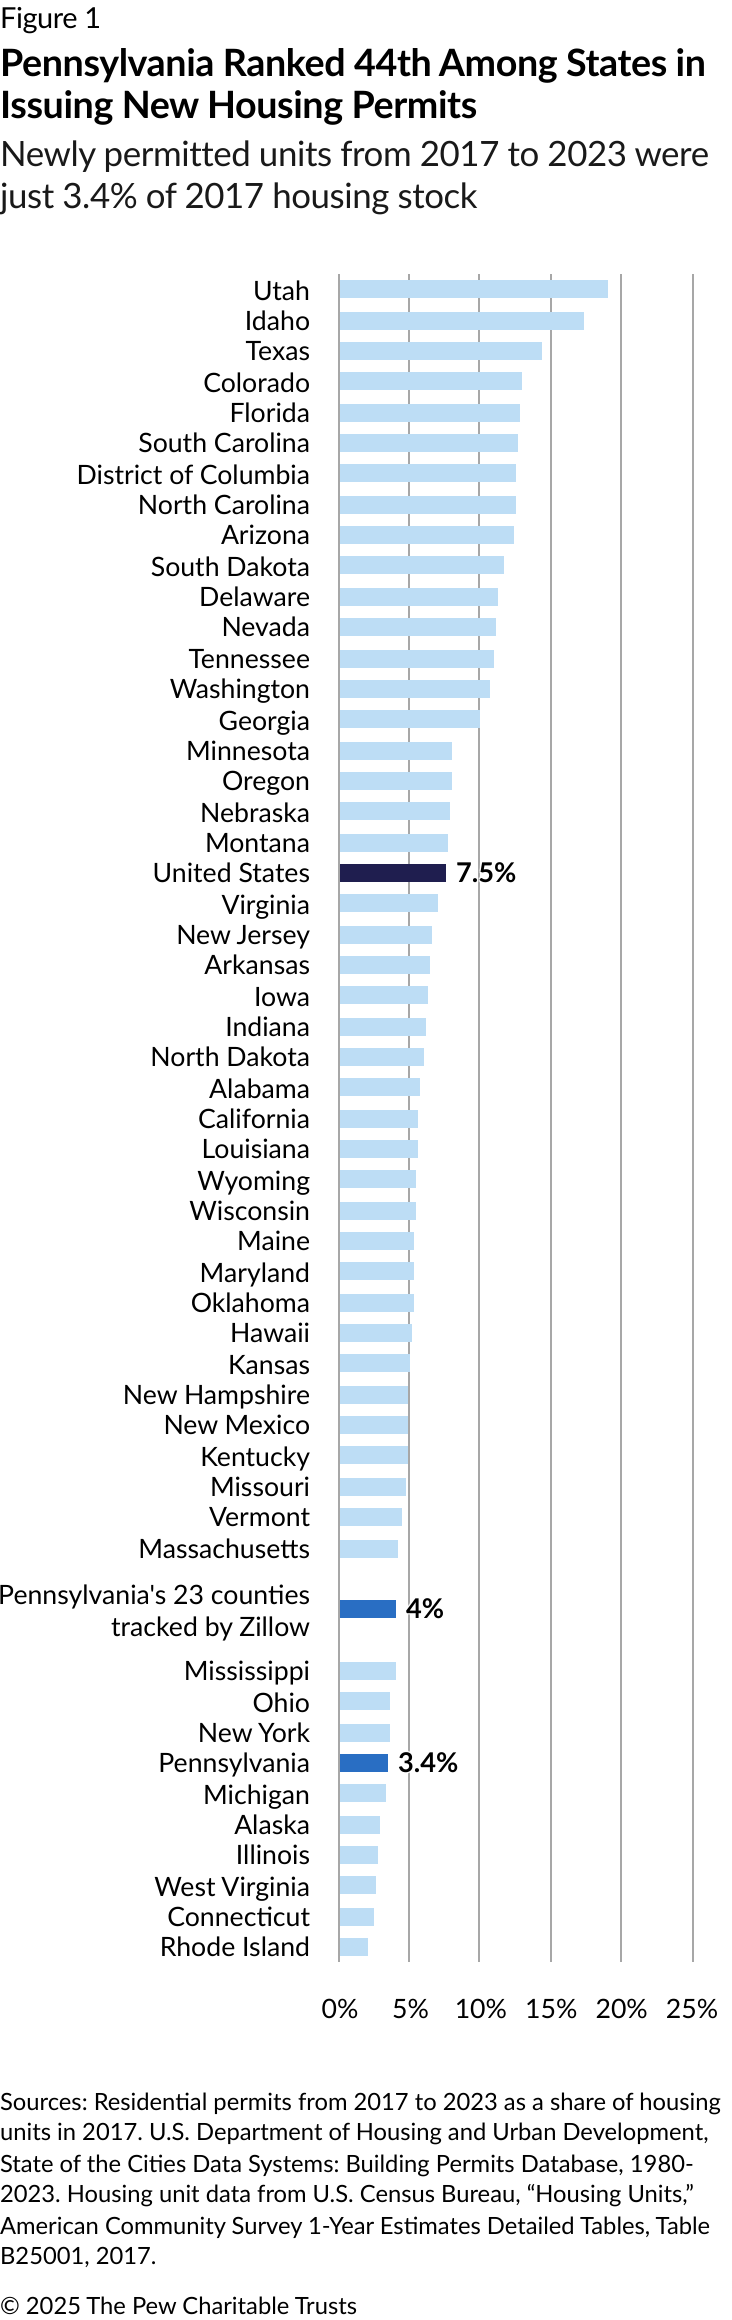
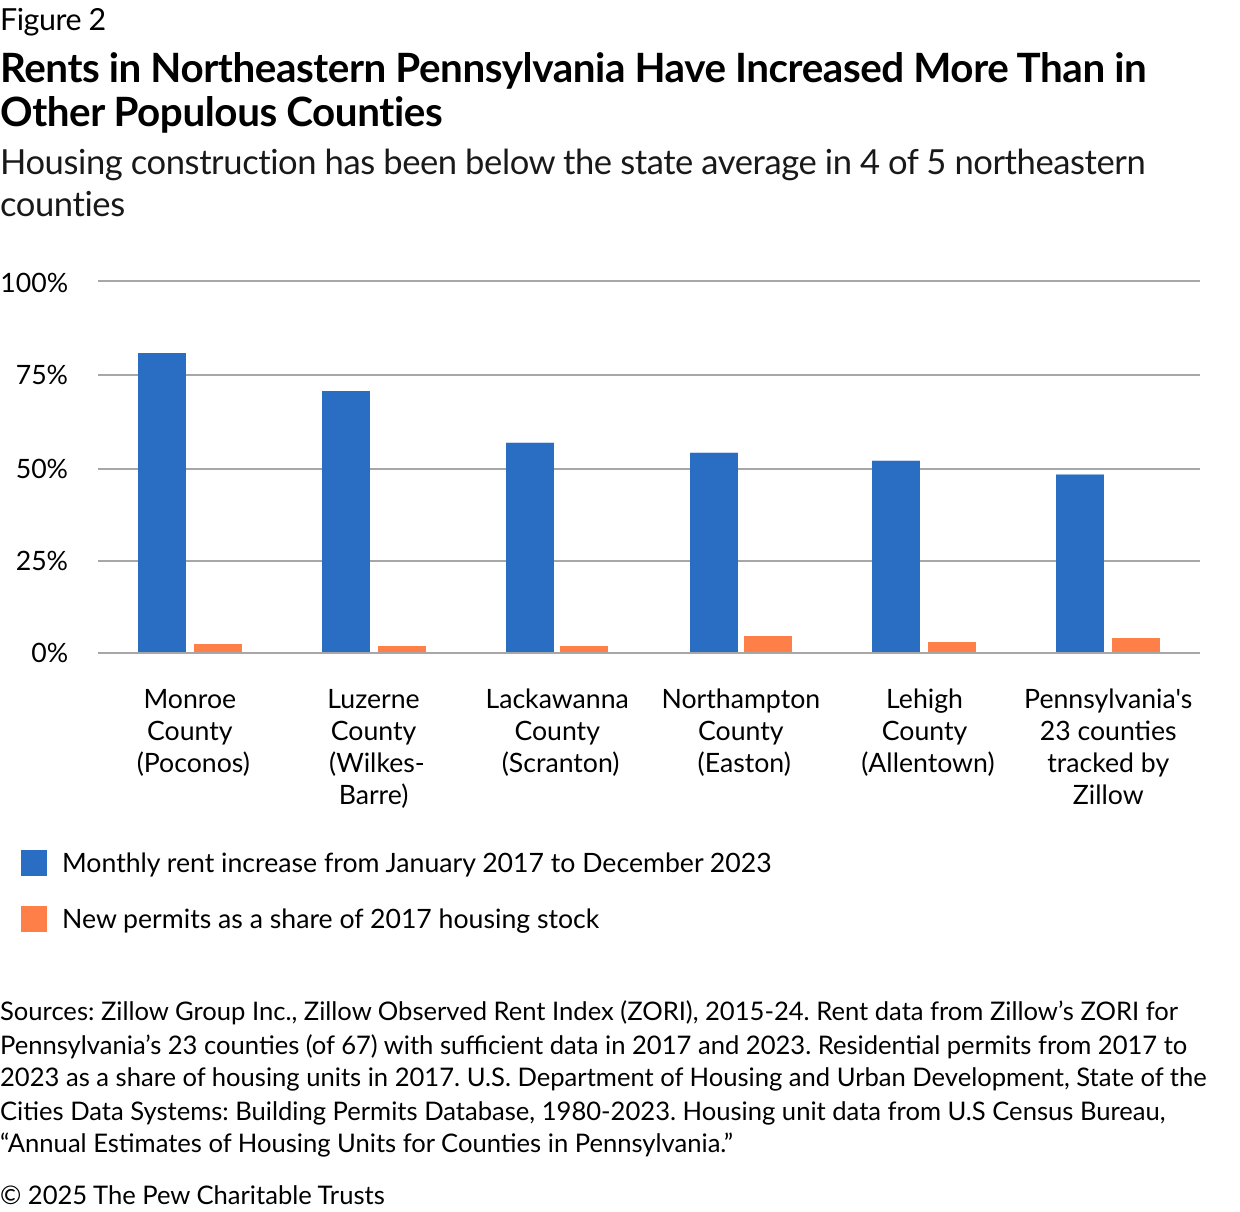
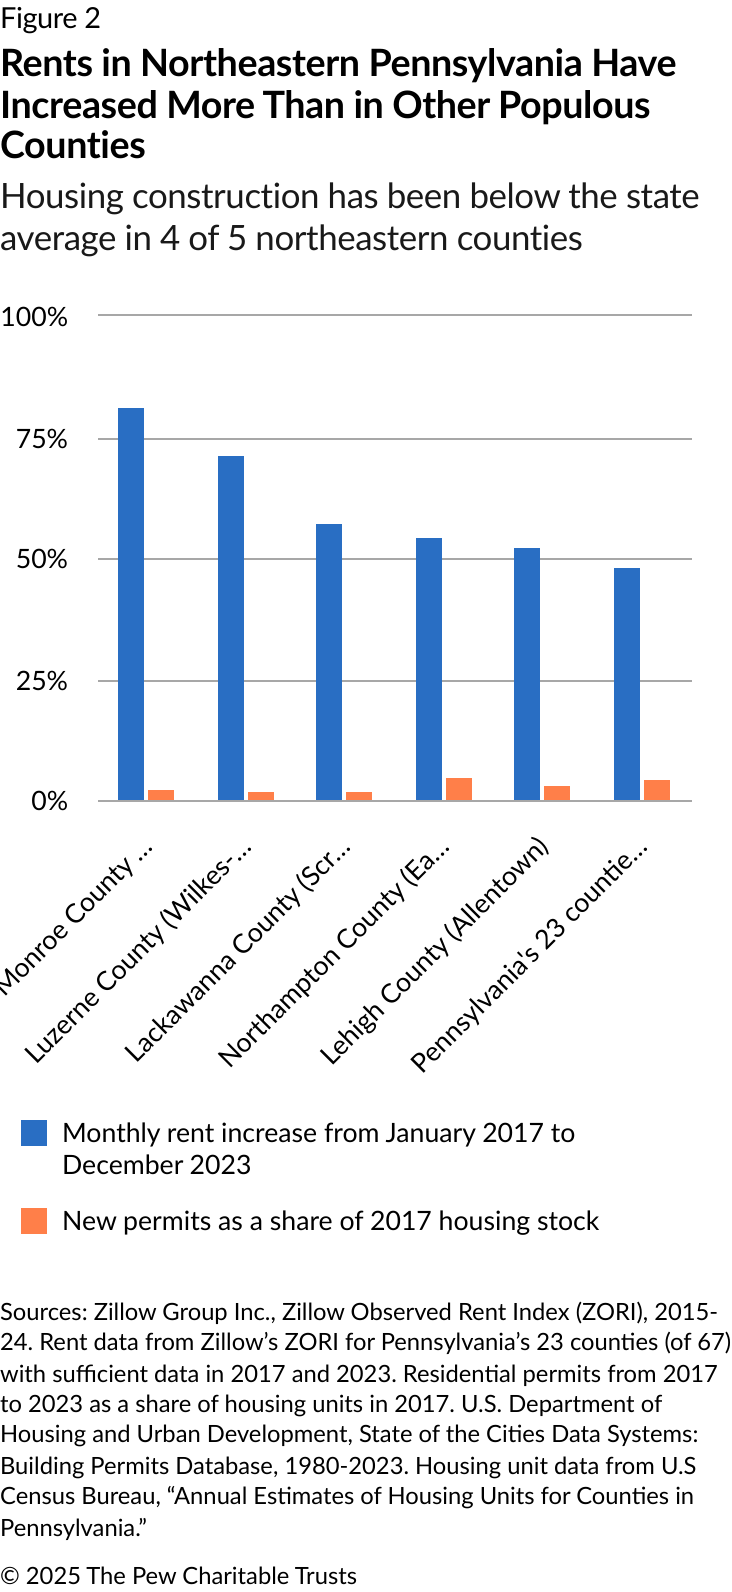
In the northeastern part of Pennsylvania, local governments issued fewer building permits than the rest of the state. From 2017 to 2023, local governments in Monroe County, the Scranton-Wilkes-Barre area, and the Lehigh Valley around Allentown approved permits totaling just 2.5% of the 2017 housing supply, less than the already-low statewide figure of 3.4%. (See Figure 2.) Rents rose faster here than in other parts of Pennsylvania—an average of 63%. That shouldn’t come as a surprise: When more people are looking for homes than there are homes available, landlords can raise rents substantially. Landlords don’t have that leverage when there is an abundance of available homes.
From 2017 to 2022, which includes the peak years of the COVID-19 pandemic, the region saw a greater demand for housing. About 97,000 people moved into northeastern Pennsylvania from New York and New Jersey while only about 32,000 Pennsylvania residents moved the opposite way. Rents and home sale prices subsequently rose because there weren’t enough homes, prompting many residents of northeastern Pennsylvania to move to less expensive parts of the state or to states with lower housing costs, such as North Carolina and Florida, according to The Pew Charitable Trusts’ analysis of Internal Revenue Service migration data.8
Regions where the fewest permits were issued saw the highest rent increases. In the Poconos, for example, Monroe County municipalities issued permits for only enough housing to increase the county’s supply by 2% from January 2017 to December 2023.9 The average rent in Monroe County rose 81% during that time, from $1,032 to $1,870 per month, well above the $1,476 average for Pennsylvania’s 23 counties tracked by Zillow. In Luzerne County, in and around Wilkes-Barre (+1.5% growth in housing permits), renters paid 71% more in 2023 than in 2017. Rent increases were somewhat lower (57%), but still well above the state average, in Lackawanna County (Scranton and its environs), where only 1.6% more homes were approved in those seven years.
By contrast, the two northeastern Pennsylvania counties that approved the most housing (Northampton and Lehigh) experienced the slowest rent growth (+54% and +52%, respectively). (See Figure 2.)
The price of homeownership also soared during this seven-year period, rising 55% statewide. Some jurisdictions saw even faster growth, making homeownership less attainable. Prices rose in the counties containing Allentown (+65%), Lewistown (+67%), Reading (+69%), Pottsville (+78%), and East Stroudsburg (+105%). Price increases this steep tend to occur only when inventory shortages become severe. Such sharp increases are often indicative of a market where not enough starter homes, such as town houses, are being built, partially because of restrictive zoning.
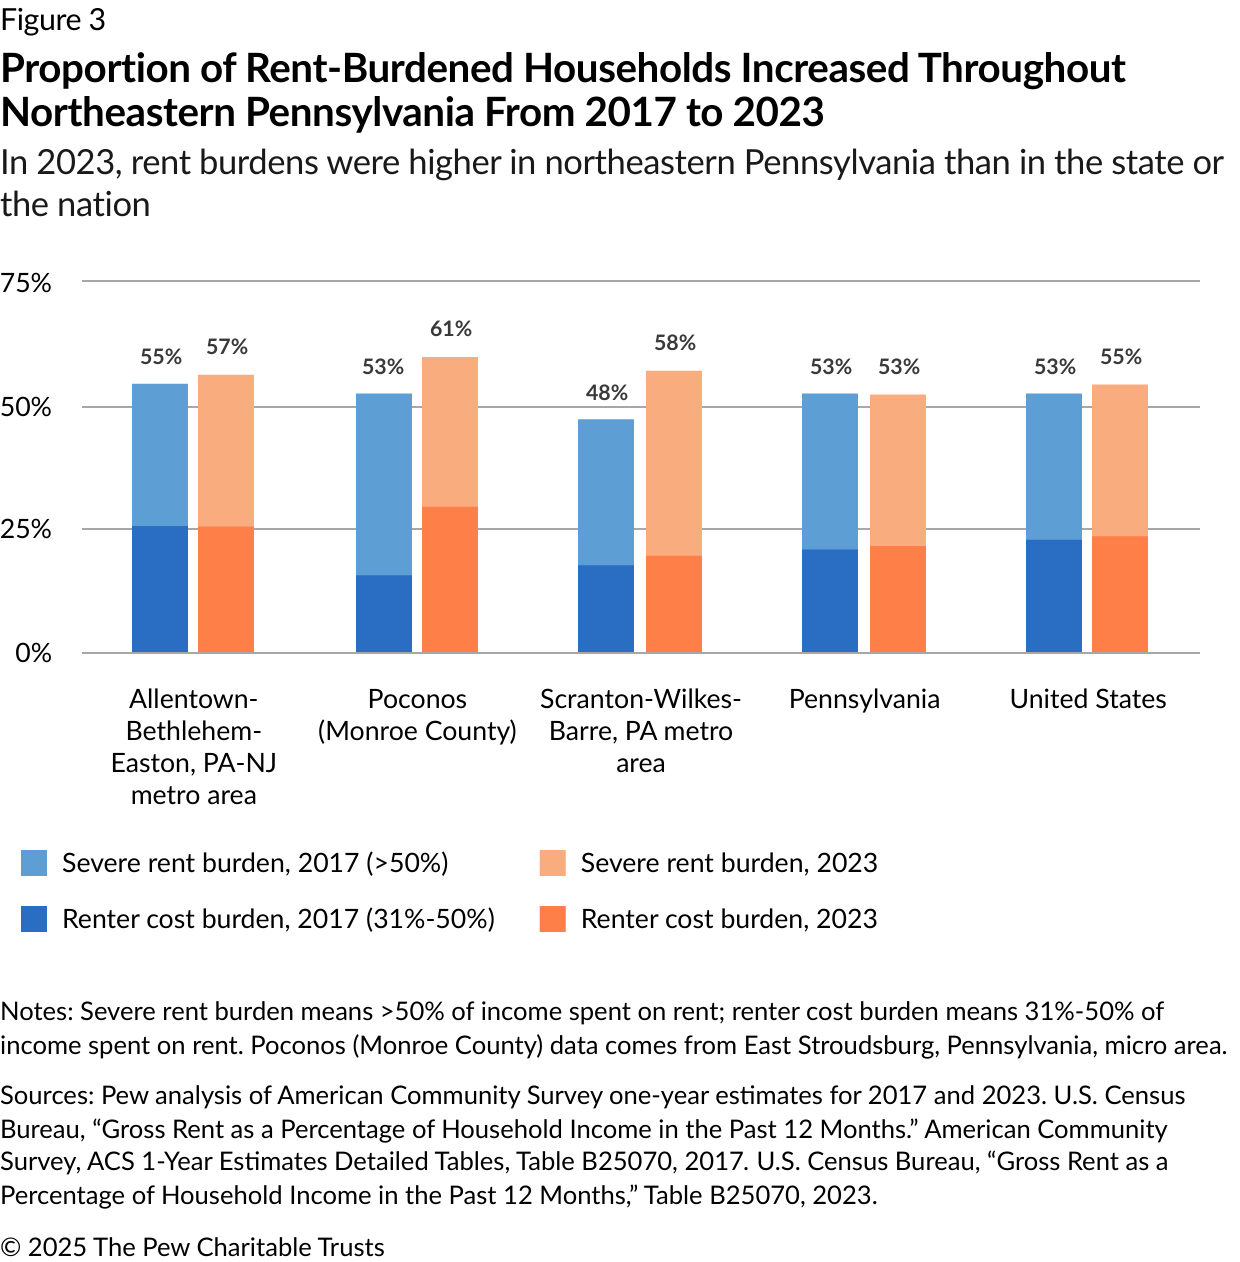
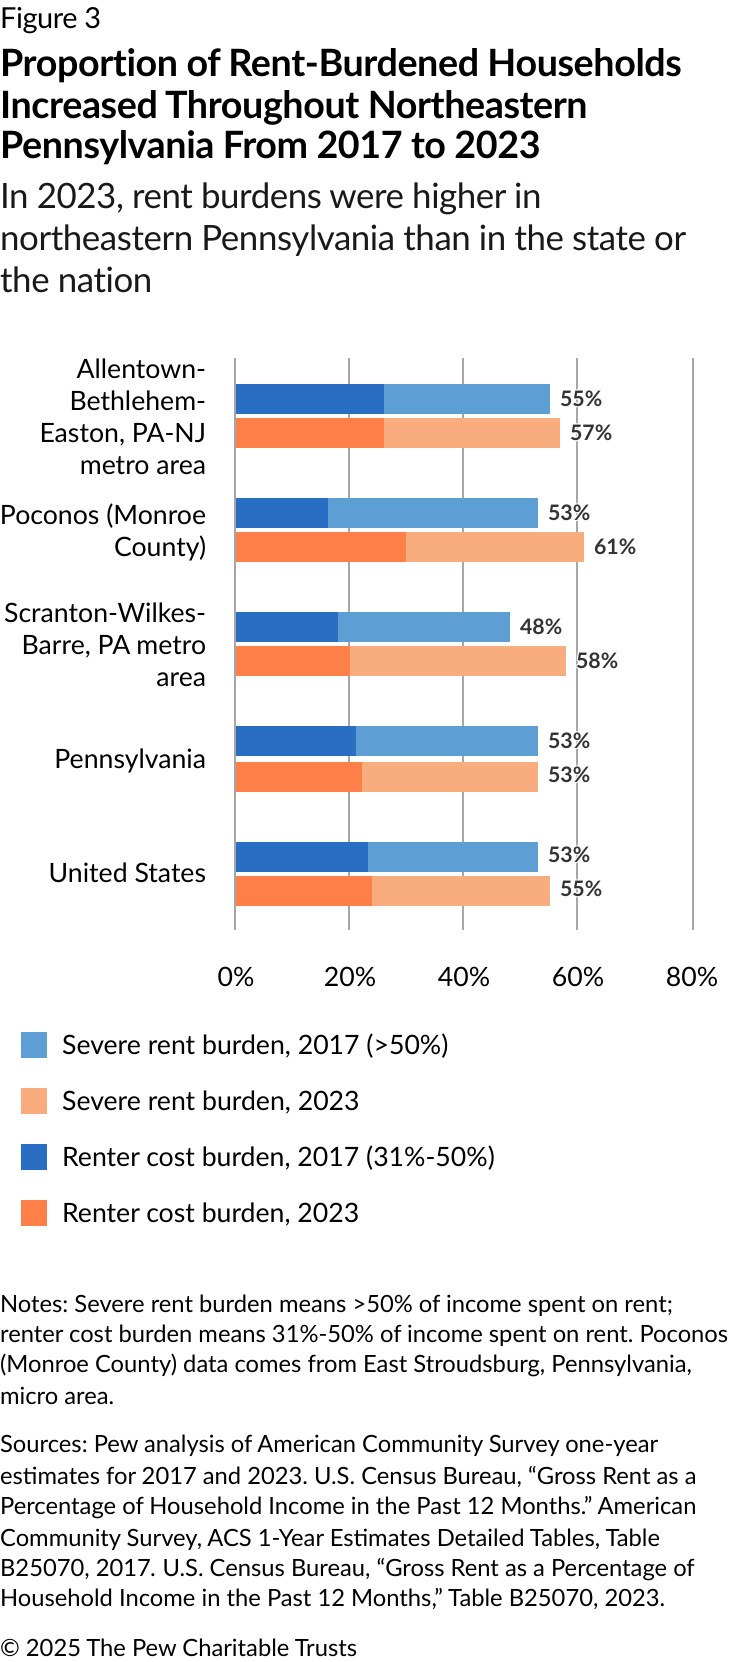
For residents who have stayed in northeastern Pennsylvania, these increases hurt. Fully 61% of Monroe County renters were considered rent-burdened in 2023, meaning they spent more than 30% of their income on housing and utilities—higher than the 55% of renters nationally or the 53% statewide who had to spend that much. (See Figure 3.)10 The Scranton-Wilkes-Barre region has also become much less affordable, with 58% of renters considered rent-burdened in 2023, compared with 48% in 2017. And 38% of renters in the region were severely burdened, spending more than half their income on housing in 2023. That’s much higher than the 30% of residents who were severely rent-burdened in 2017. (See Figure 3.)
Runaway rents in the Philadelphia suburbs
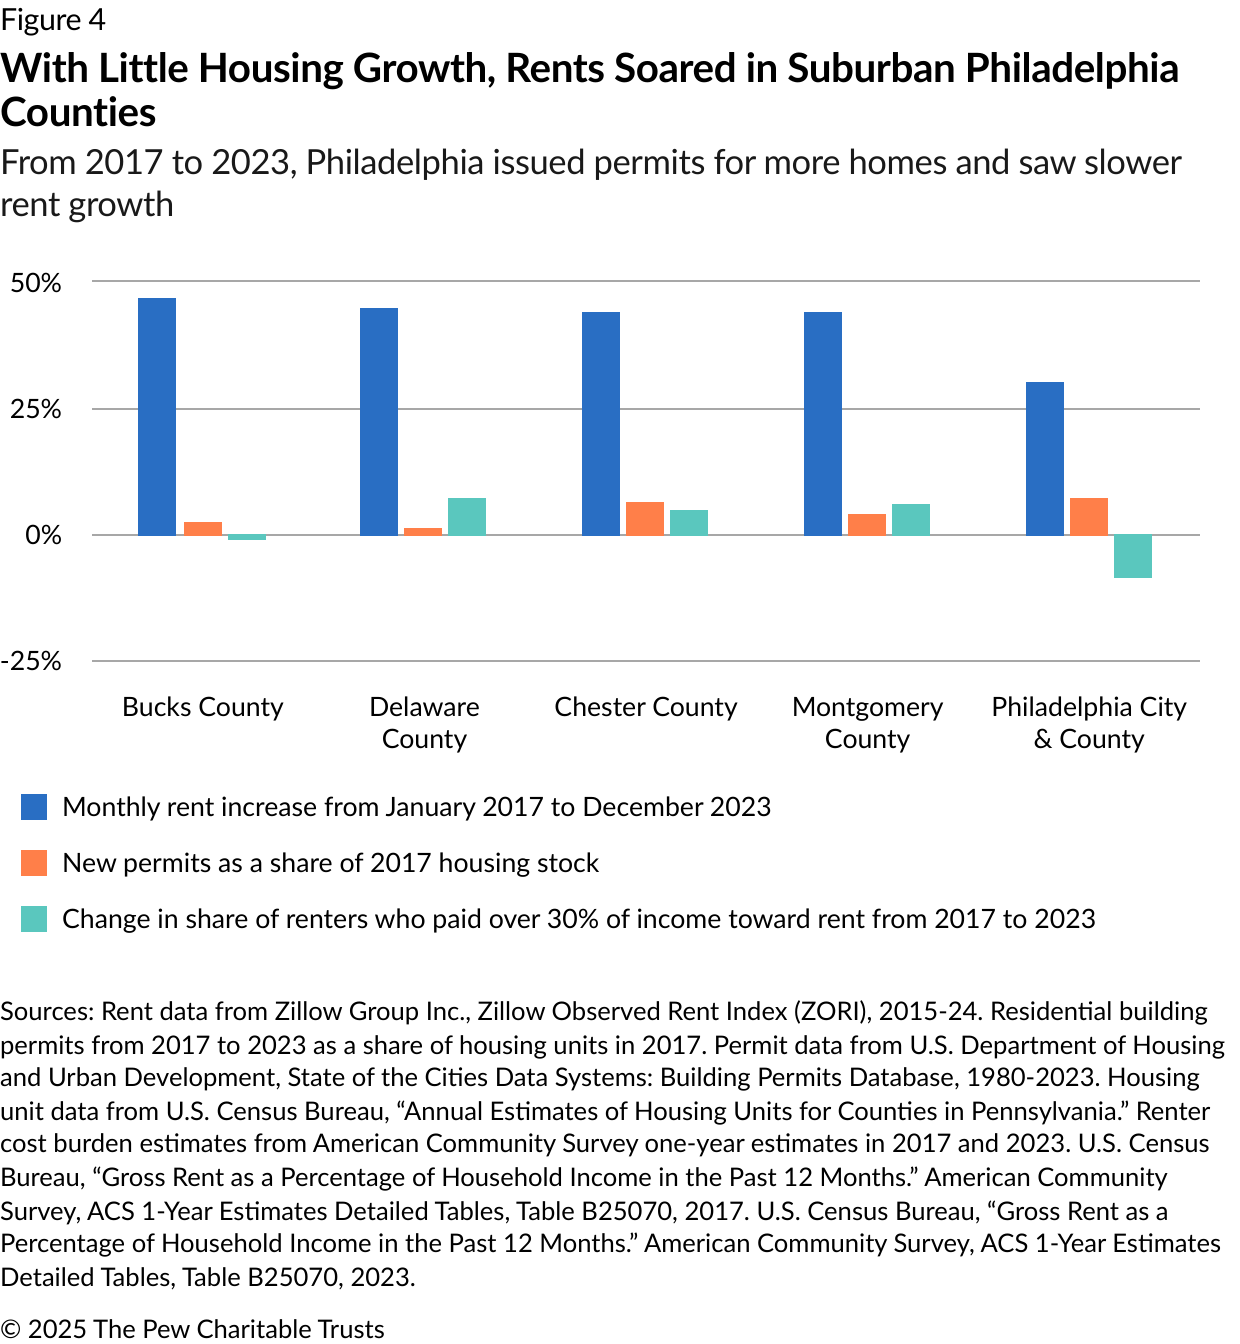
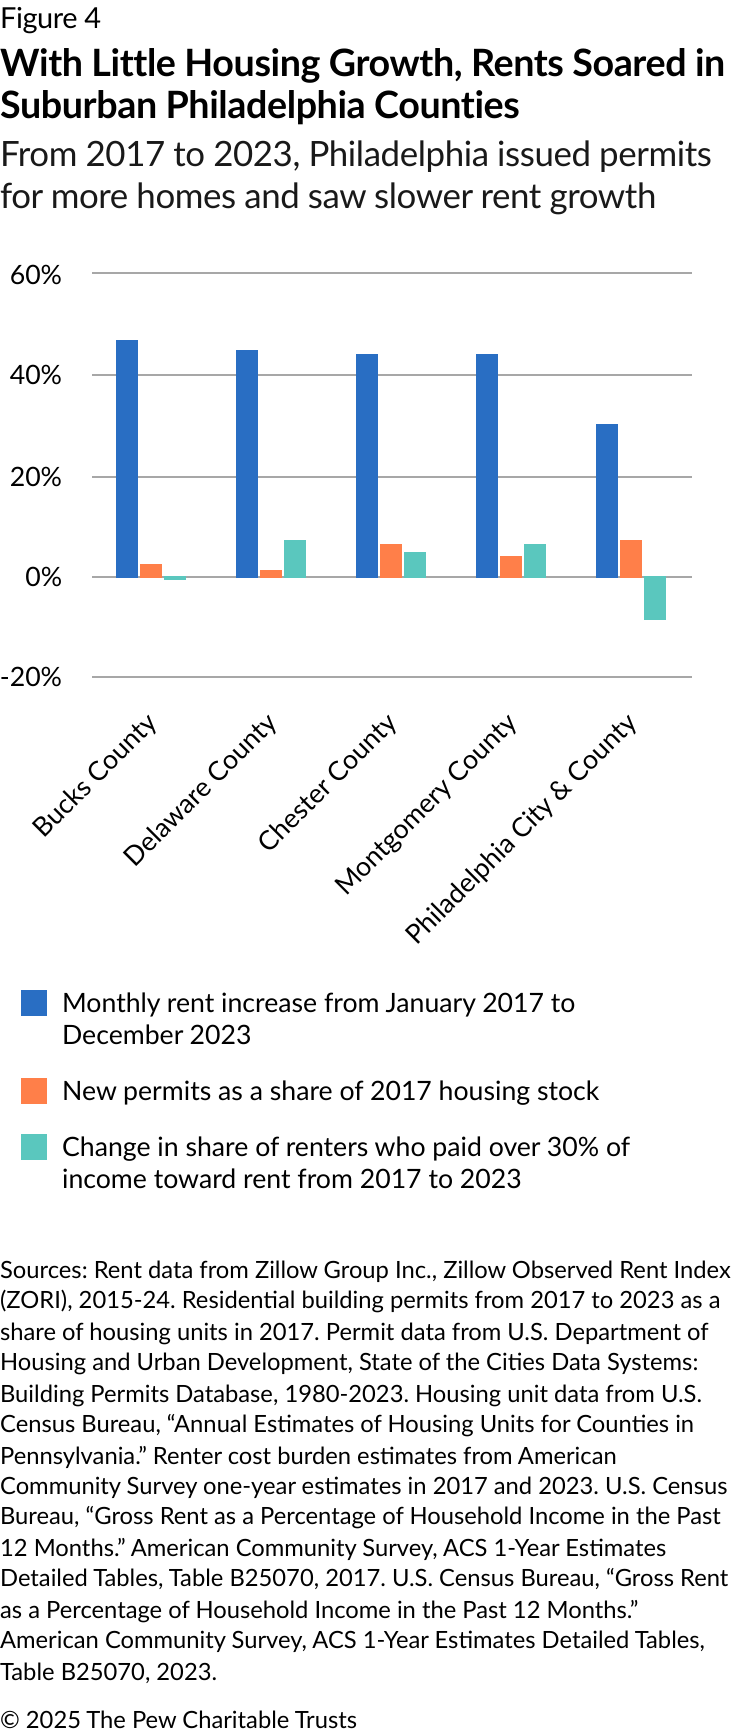
Philadelphia and its suburbs present a clear picture of the relationship between new home construction and housing prices. From 2017 to 2023, Philadelphia issued nearly twice as many building permits, proportionally, as Pennsylvania’s statewide average (7.2% versus 3.4%). But the city’s suburbs added less housing—as little as 1.2% in Delaware County and 2.4% in Bucks County. Rents in the city increased by 30% in those seven years, but they rose 44% to 47% in neighboring counties on the Pennsylvania side of the Delaware River. (See Figure 4.)
Renters felt the pinch, especially in Chester, Montgomery, and Delaware counties, where the share of households spending more than 30% of their income on rent and utilities rose from 2017 to 2023. The increase was highest in Delaware County, where the portion of rent-burdened households increased 7.1% in seven years.
Local governments in Chester and Montgomery counties issued proportionally more permits than neighboring Bucks and Delaware counties from 2017 to 2023, but rents still increased by 44% in both counties in seven years. (See Figure 4.) Moreover, the increase in the number of rent-burdened households—6.1% in Montgomery County and 4.8% in Chester County—suggests that even more new homes were necessary to maintain prior levels of affordability.
In contrast, Philadelphia permitted more housing growth than its suburbs. Partly as a result, the number of rent-burdened households in the city fell by more than eight percentage points as it rose elsewhere. But even this additional housing still fell short of what the city needed: The average monthly rent increased by $394 (30%) from 2017 to 2023, well above the rate of inflation.
Counties that issued the most permits saw the slowest rent growth
The undersupply of housing and large rent increases also plagued other parts of the state—not just in the Philadelphia region and northeastern Pennsylvania. Several metropolitan areas within about two hours’ drive of Philadelphia also experienced significant population growth (2% or more) and large rent increases from 2017 to 2023, such as Reading (rents +62%) and Lancaster (+57%). Harrisburg (+50%), Carlisle (+49%), and York counties (+49%) had rent increases in line with the 23 Pennsylvania counties tracked by Zillow.
These smaller metropolitan areas remain bastions of relatively affordable housing. December 2023 rents in those five cities averaged $1,364, well below Philadelphia’s suburbs ($1,979) and the city itself ($1,672). But local governments in these areas issued permits for an increase in housing units of about 4.3% from 2017 to 2023—above the state average but well below the increase in Philadelphia. Without the construction of more housing, the relative affordability of these metropolitan areas may be eroded or even erased in the future. Cumberland County, which contains Carlisle and Mechanicsburg, was an exception: The population surged more than 7% from 2017 through 2023, and communities there approved 7,700 building permits, 7.3% of the 2017 housing stock. This new housing was just enough to keep rents to a near-average 49% increase from 2017 to 2023.
Farther west of the Susquehanna River, rent increases were lower than the 46% average in the Pennsylvania counties tracked by Zillow, but higher than Philadelphia’s 30% average increase. Rents in the Pittsburgh region increased 36% from 2017 to 2023, while jurisdictions issued permits totaling only 2.9% of the housing stock. Communities in Erie County, in the state’s northwest corner, issued permits for just 1.3% more homes—and saw rents climb by 40%. Johnstown (Cambria County) was similar: 43% rent growth and permits for only 0.7% more new units.
On the other hand, the two Pennsylvania counties with the smallest rent increases allowed the construction of above-average levels of new housing. Local governments in Butler County, north of Pittsburgh, issued permits to increase the housing stock by 8.4%. Rents grew 29% in seven years. Communities in Centre County, home to Penn State’s flagship campus, allowed permits for 4.9% more units; rents increased 28% from 2017 to 2023.
Examples of local zoning rules that restrict new housing
Many Pennsylvania communities have laws that limit the construction of new housing, and thus housing supply. One common way zoning laws prevent more housing from being built is by requiring that just one house, which usually houses just one family, sits on a relatively large lot—in some cases, a full acre or nearly two. Examples from across the state highlight the pervasiveness of this policy.
In the Philadelphia suburb of Lower Gwynedd, in Montgomery County, a single-family home requires at least 35,000 square feet of land—more than three-quarters of an acre.11 Nearby Doylestown (Bucks County) requires at least 80,000 square feet of land per home—nearly two acres.12 Both towns—and most other suburban communities—have water and sewer access; the existing infrastructure could serve many more homes than are currently allowed by law. If zoned differently, that one Doylestown lot could hold 40 town houses on 2,000-square-foot lots, with each two- or three-story home as large as the U.S. median new single-family house (2,233 square feet in 2023).13
In northeastern Pennsylvania, East Stroudsburg, the largest municipality in Monroe County, requires at least 12,500 square feet of land for each house in some areas. Even in the borough’s relatively high-density residential areas, every new house must have at least a 7,500-square-foot lot.14 In the western part of the state, Erie County has a minimum lot size of 7,200 square feet, even in areas with sewer and water service.15 South Fayette, a suburb of Pittsburgh, requires 20,000-square-foot lots for suburban residential homes, even in areas with existing sewer service.16
Philadelphia, on the other hand, has more varied and in some cases more permissive zoning than its suburbs on the Pennsylvania side of the Delaware River. Although minimum lot sizes are as high as 10,000 square feet in some areas of the city zoned for detached single-family housing,17 in other areas, Philadelphia allows single-family row houses on lots as small as 700 square feet. Other parts of the city are zoned to allow multifamily apartments or condominiums and mixed-use buildings. Flexible zoning has allowed for the development of more housing, and Philadelphia issued permits for new housing at about twice the statewide rate from 2017 to 2023; its rent increases were much less than statewide (30% in Philadelphia, compared with 46% in the 23 Pennsylvania counties tracked by Zillow).
Most Pennsylvania communities also either forbid or make it difficult to build accessory dwelling units (ADUs), which can play an important role in adding more housing units across all neighborhood types. The American Planning Association defines an ADU as “a smaller, independent residential dwelling unit located on the same lot as a stand-alone (i.e., detached) single-family home.”18 There are many different types of ADUs—for example, attic and basement apartments, converted garages, and above-garage apartments. With their combination of proximity to a single-family home and allowance for independent living, ADUs also provide opportunities for aging in place and multigenerational living.
Many jurisdictions do not allow ADUs or allow them only with a special use permit, which adds time and increases approval costs. Even where ADUs are allowed, minimum size regulations prevent them from being built or being financially viable.19 Lehigh County, for example, requires an ADU to have at least 1,000 square feet of living space.20 Cambria County, east of Pittsburgh, has an 800-square-foot minimum.21 Such minimums—roughly twice the size of a typical above-the-garage apartment or granny flat—significantly raise the costs of building an ADU.22
What Minneapolis and Houston did to increase housing supply
Pennsylvania’s experience mirrors what’s happening in other parts of the country: Housing costs are rising where population growth is not met by additional housing supply. Although rent growth in Pennsylvania’s counties tracked by Zillow (+46%) was similar to growth in the U.S. as a whole (+47%) from 2017 to 2023, Pennsylvania permitted many fewer housing units (3.4% of the state’s 2017 housing stock, compared with 7.5% for the entire U.S.). More specifically, areas where zoning laws prevent the construction of less expensive housing—such as town houses, duplexes, triplexes, apartment buildings, and manufactured housing—saw large increases in housing prices.23
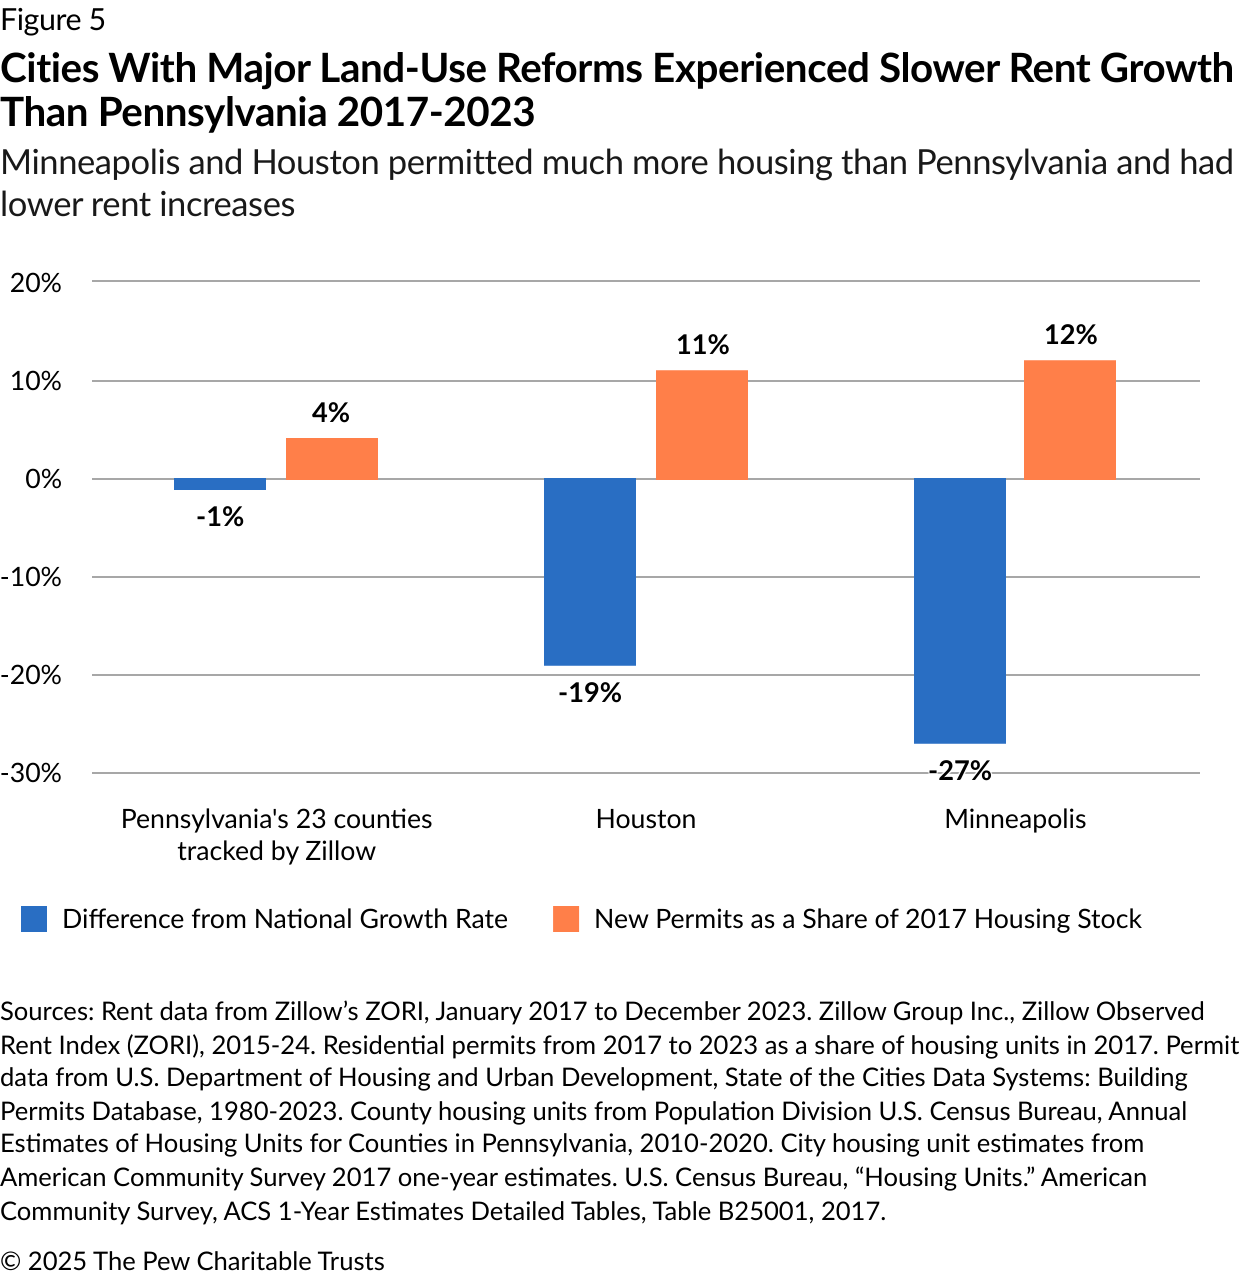
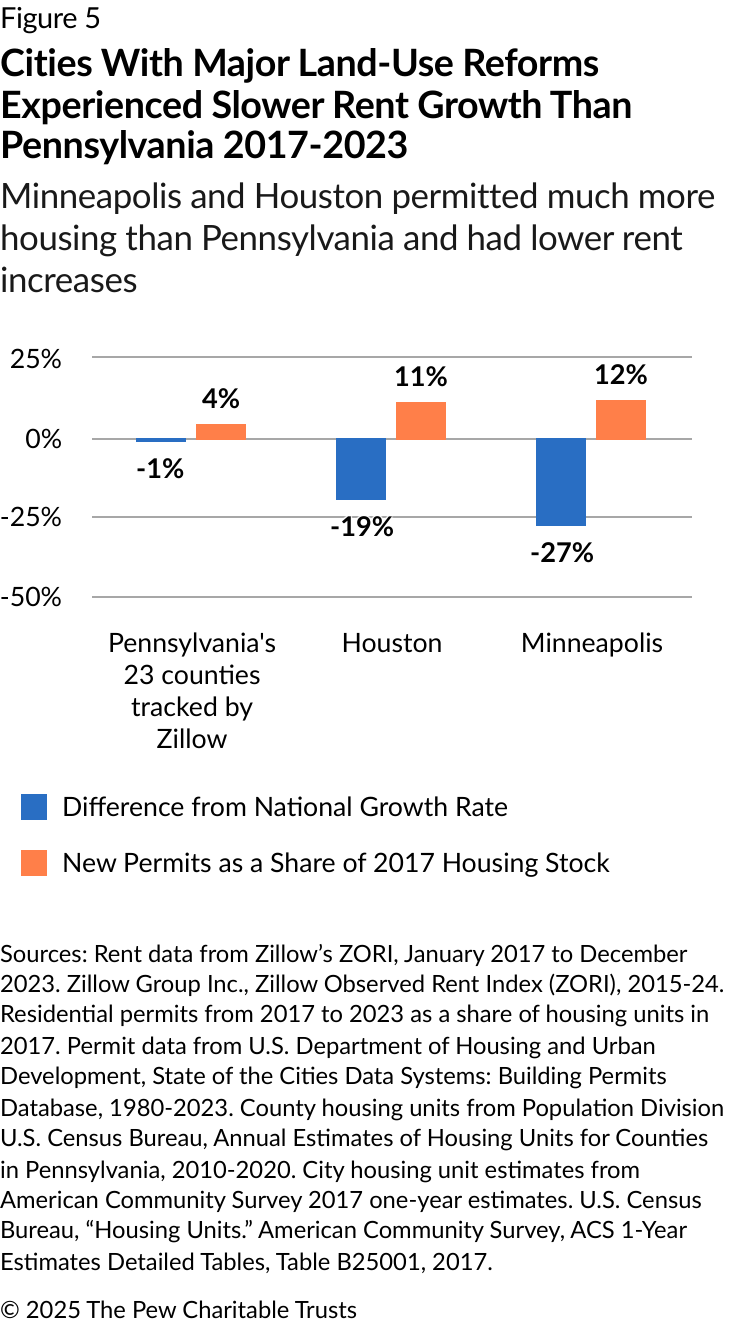
As counterexamples, Houston and Minneapolis illustrate what governments can do to increase the availability of lower-cost housing. Houston relaxed its minimum lot requirements in the city’s urban core in 1998, reducing the minimum lot size from 5,000 to 1,400 square feet of land for most homes. It expanded this program citywide in 2013.24 The result was a boom in new town houses, many of them affordable to households with median incomes.25 Enabled by lot-size reform and other government actions, Houston issued permits for 102,000 housing units from 2017 to 2023, about 11% of its 2017 housing stock; the city’s average rent increased 28% in that period, 19 percentage points below the national average (47%). (See Figure 5.)26
Since 2009, Minneapolis has also instituted major zoning changes designed to increase its housing supply. It allowed the construction of more apartment buildings along commercial corridors, then reduced and eventually eliminated parking requirements. And in 2020, it began allowing duplexes and triplexes citywide. The results are striking: From 2017 to 2023, the city issued enough building permits to increase the number of housing units by 12%. According to Pew research, the vast majority of those new units were in apartment buildings—and less expensive than single-family homes.27
Minneapolis experienced rent increases well below state and national averages from 2017 to 2023, despite a 12.7% increase in the number of households in the city. (See Figure 5.)28 Had rents in Minneapolis grown as much as in the rest of Minnesota, the city’s renters would be spending an estimated $1,700 more annually in rent.29 In 2017, a Minneapolis resident had to earn 80% of the area median income to afford the median apartment rent. By 2023, that figure had fallen to 66%.30
What can Pennsylvania do?
Although land-use regulation and zoning remain largely the responsibility of local governments nationwide, many states have enacted legislation designed to increase housing supply, at least 10 of them—Arizona, Colorado, Florida, Hawaii, Maryland, Montana, Rhode Island, Tennessee, Vermont, and Washington—in 2023 and 2024 alone.31 Montana, for example, passed laws to allow residential buildings in commercial areas, enabled ADUs without parking or owner-occupancy requirements, and streamlined permitting processes.32 Washington made condominium construction easier, allowed small multifamily units in larger cities where only single-family homes had been allowed, and standardized the design review process.33 Laws like these have strong, bipartisan public support, as evidenced by a 2023 Pew survey of 5,051 adults nationwide.34 Eighty-one percent, for instance, supported allowing apartments near bus and train stations or major job centers.
Pennsylvania policymakers have numerous options, which draw on successful policies enacted elsewhere:
- Allow small multifamily buildings (duplexes and triplexes) on lots that now permit only single-family homes.
- Permit the construction of accessory dwelling units—including in attics, basements, and backyards—on lots that now permit only single-family homes.
- Reform permitting laws to simplify and speed up the process.
- Allow more apartments near commercial areas and public transportation.
- Reduce or remove minimum parking mandates that increase the cost of building multifamily dwellings.
- Convert commercial buildings to apartments.
- Enable the construction of housing on land owned by nonprofit organizations, educational institutions, and religious organizations, such as churches.
Data from cities such as Houston and Minneapolis, which made similar changes years ago, suggests that these laws are likely to improve housing affordability, saving Pennsylvania residents hundreds, and in some cases thousands, of dollars per year. Had Pennsylvania made some of these changes and added more housing earlier, rents would now be lower.35 Further afield, research from the United Kingdom and Australia suggests that for every 10% that a region adds to its housing supply, housing costs are 11% to 22% lower than they would have been without the additional housing.36 The average rent in the 23 Pennsylvania counties tracked by Zillow was $1,476 in 2023. A 10% increase in housing supply would thus have saved a typical household $162 to $325 per month—as much as $3,900 per year.
These savings would help Pennsylvania residents who are struggling to pay their bills or to become first-time homeowners. Local businesses also would benefit from the additional spending power of residents who were not burdened by large monthly rent payments. The examples provided by other states and localities provide a possible roadmap for Pennsylvania lawmakers looking to increase housing availability—and to give a boost to the state and local economies.
Acknowledgments
This brief was researched and written by Pew staff members Seva Rodnyansky, Kery Murakami, and Alex Horowitz. The project team thanks Demetra Aposporos, Esther Berg, Zach Bernstein, Laurie Boeder, Erika Compart, Gabriela Domenzain, Carol Hutchinson, Abi Ingoglia, Avi Meyer, Bernard Ohanian, Briana Okebalama, Chelsie Pennello, Travis Plunkett, Drew Swinburne, Jeff Thiebert, and Gaye Williams for providing important communications, creative, editorial, and research support.
Endnotes
- Zillow’s Zillow Observed Rent Index (ZORI) rent estimates reflect the mean of the middle 30% of the rental housing market (the 35th to 65th percentile). The methodology uses a weighted index and assigns a dollar value for each month’s per-unit rent to ease interpretation. We will refer to these as average rent, for interpretation simplicity. See “Methodology: Zillow Observed Rent Index (ZORI),” Zillow Group Inc., https://www.zillow.com/research/methodology-zori-repeat-rent-27092/. In Pennsylvania, ZORI rent estimates are available for 23 counties during our time range. Counties with data from January 2017 to December 2023 include: Allegheny, Berks, Bucks, Chester, Cumberland, Dauphin, Delaware, Erie, Franklin, Lackawanna, Lancaster, Lehigh, Luzerne, Monroe, Montgomery, Northampton, Philadelphia, Washington, and York. Additionally, Butler, Cambria, Centre, and Westmoreland counties had Zillow ZORI data for some part of 2017 or early 2018 and were included in this analysis for completeness. “Zillow Observed Rent Index (ZORI),” Zillow Group Inc., 2015-24, https://www.zillow.com/research/data/.
- Wages in Pennsylvania increased by 26% from 2017 Q1 to 2023 Q2. “Average Weekly Wage in Total Covered Total, All Industries for All Establishment Sizes in Pennsylvania—Statewide, NSA, Series ID: ENU4200040010” Bureau of Labor Statistics, Quarterly Census of Employment and Wages (QCEW), 2014-2024, https://data.bls.gov/series-report. Consumer goods prices from “Consumer Price Index for All Urban Consumers: All Items Less Shelter in U.S. City Average,” Federal Reserve Bank of St. Louis, https://fred.stlouisfed.org/series/CUUR0000SA0L2.
- “Intercensal Estimates of the Resident Population for Counties in Pennsylvania: April 1, 2010 to April 1, 2020,” U.S. Census Bureau, https://www2.census.gov/programs-surveys/popest/tables/2010-2020/intercensal/county/co-est2020int-pop-42.xlsx. “Annual Estimates of the Resident Population for Counties in Pennsylvania: April 1, 2020 to July 1, 2023,” U.S. Census Bureau, Population Division, https://www2.census.gov/programs-surveys/popest/tables/2020-2023/counties/totals/co-est2023-pop-42.xlsx.
- New York City rents are an average of Zillow’s ZORI rents in the five New York City counties: Kings, Queens, New York, Bronx, and Richmond. Suburban New York and New Jersey counties include those in the New York-Newark-Jersey City metropolitan area available in Zillow ZORI from January 2017 to December 2023. These are Suffolk, Nassau, Westchester, and Rockland counties in New York, and Bergen, Middlesex, Essex, Hudson, Monmouth, Ocean, Union, Passaic, Morris, Somerset, and Hunterdon counties in New Jersey. “Zillow Observed Rent Index (ZORI),” Zillow Group Inc.
- Average percentage change of Zillow Home Values Index (ZHVI) for Monroe, Northampton, Luzerne, Lackawanna, and Lehigh counties in Pennsylvania. Zillow Group Inc., “Zillow Home Value Index (ZHVI),” https://www.zillow.com/research/data/. Federal Reserve Bank of St. Louis, “Housing Inventory: Active Listing Count in the United States,” 2024, https://fred.stlouisfed.org/series/ACTLISCOUUS.
- Pennsylvania Department of Community and Economic Development, “Reducing Land Use Barriers to Affordable Housing, Planning Series #10,” 2015, http://www.alleghenyplaces.com/pdf/Reducing%20Land%20Use%20Barriers%20to%20Affordable%20Housing.pdf.
- “State of the Cities Data Systems: Building Permits Database,” U.S. Department of Housing and Urban Development, 1980-2023, https://socds.huduser.gov/permits/index.html. Brian Potter, “Why Are There So Few Economies of Scale in Construction?,” https://www.construction-physics.com/p/why-are-there-so-few-economies-of.
- “SOI Tax Stats—Migration Data,” Internal Revenue Service, https://www.irs.gov/statistics/soi-tax-stats-migration-data.
- Local governments issue building permits to builders allowing them to add new housing units. Building permits are an estimate of expected demand for new housing units. Issuing a building permit does not necessarily mean that a building is built or a home is added. In Pennsylvania, for every one unit added to the housing stock from 2000 to 2023, 1.14 units were permitted; nationally, for every one unit added to the housing stock from 2000 to 2023, 1.01 units were permitted. Not issuing building permits means no new units are added. “State of the Cities Data Systems: Building Permits Database,” U.S. Department of Housing and Urban Development.
- Monroe County housing cost burdens are based on the figures for the East Stroudsburg MSA, which encompasses Monroe County.
- A-1 Residential District: Permitted Uses, 1258.03.a.3, Township of Lower Gwynedd, PA, https://ecode360.com/13449907#13449909.
- Dimensional Requirements, 175-17:G2, Township of Doylestown, https://ecode360.com/10730600#10730601.
- U.S. Census Bureau, “Highlights of 2023 Characteristics of New Housing,” https://www.census.gov/construction/chars/highlights.html.
- Table of Bulk Regulations Governing the Size of Lots, Yards and Buildings for Permitted Uses Only, 157-36, Borough of East Stroudsburg, 2022, https://ecode360.com/attachment/EA0636/EA0636-157b%20Table%20of%20Bulk%20Regulations.pdf.
- Erie County Subdivision and Land Development Ordinance: Lot and Yard Requirements, 502.9.a, Erie County, PA, 2019, https://eriecountypa.gov/wp-content/uploads/2021/08/Erie-County-SALDO-as-Amended-5-28-19.pdf.
- R-2 Suburban Residential District: Area and Bulk Regulations, 240-23.a.2.b, Township of South Fayette, PA, https://ecode360.com/11615744#11615795.
- The Philadelphia Code: Zoning and Planning: Development Standards: Dimensional Standards for Lower Density Residential Districts, 14-701-1, City of Philadelphia, https://codelibrary.amlegal.com/codes/philadelphia/latest/philadelphia_pa/0-0-0-292815#JD_14-701.
- “Accessory Dwelling Units,” American Planning Association, https://www.planning.org/knowledgebase/accessorydwellings/.
- Zoe Harper, “ADU Laws and Regulations in Pennsylvania,” Steadily, Jan. 18, 2024, https://www.steadily.com/blog/adu-laws-and-regulations-in-pennsylvania.
- Lehigh County Zoning Code—Minimum Habitable Floor Area, 180-35, Lehigh County, PA, 2023, https://ecode360.com/13034192#13034292.
- Cambria County Zoning Code: Conversion Apartment, 27-901, Cambria County, PA, 2013, https://cambriaplanning.org/wp-content/uploads/2013/04/chapter-27-zoning.pdf.
- “Tiny Home Regulations in PA: The Complete Guide,” Zook Cabins, https://www.zookcabins.com/regulations/tiny-home-regulations-in-pennsylvania.
- “More Flexible Zoning Helps Contain Rising Rents,” The Pew Charitable Trusts, Alex Horowitz and Ryan Canavan, https://www.pewtrusts.org/en/research-and-analysis/articles/2023/04/17/more-flexible-zoning-helps-contain-rising-rents. “Rigid Zoning Rules Are Helping to Drive up Rents in Colorado,” Alex Horowitz and Ryan Canavan, The Pew Charitable Trusts, https://www.pewtrusts.org/en/research-and-analysis/articles/2023/04/27/rigid-zoning-rules-are-helping-to-drive-up-rents-in-colorado. “New York’s Housing Shortage Pushes up Rents and Homelessness,” Alex Horowitz, The Pew Charitable Trusts, https://www.pewtrusts.org/en/research-and-analysis/articles/2023/05/25/new-yorks-housing-shortage-pushes-up-rents-and-homelessness.
- For every area that had wastewater collection services. Emily Hamilton, “The Effects of Minimum-Lot-Size Reform on Houston Land Values,” Mercatus Center of George Mason University, 2024, https://www.mercatus.org/research/working-papers/effects-minimum-lot-size-reform-houston-land-values.
- “Lot-Size Reform Unlocks Affordable Homeownership in Houston,” The Pew Charitable Trusts, https://www.pewtrusts.org/en/research-and-analysis/issue-briefs/2023/09/lot-size-reform-unlocks-affordable-homeownership-in-houston.
- “Zoning Reform Can Reduce Homelessness,” Alex Horowitz and Lisa Marshall, The Pew Charitable Trusts, https://www.pewtrusts.org/en/about/news-room/opinion/2024/02/19/zoning-reform-can-reduce-homelessness.
- “Minneapolis Land Use Reforms Offer a Blueprint for Housing Affordability,” Alex Horowitz, Linlin Liang, and Adam Staveski, The Pew Charitable Trusts, Jan. 4, 2024, https://www.pewtrusts.org/en/research-and-analysis/articles/2024/01/04/minneapolis-land-use-reforms-offer-a-blueprint-for-housing-affordability.
- City of Minneapolis, Zoning Code Text Amendments Subdivision Ordinance Amendments Heritage Preservation Ordinance Amendments (2018), https://www2.minneapolismn.gov/media/content-assets/www2-documents/business/Zoning-Code-Text-Amendments-Approved-2004-2018.pdf. Alex Horowitz, Linlin Liang, and Adam Staveski, “Minneapolis Land Use Reforms Offer a Blueprint for Housing Affordability.”
- Alex Horowitz, Linlin Liang, and Adam Staveski, “Minneapolis Land Use Reforms Offer a Blueprint for Housing Affordability.”
- “Gross Rent as a Percentage of Household Income in the Past 12 Months,” U.S. Census Bureau, https://data.census.gov/table/ACSDT1Y2011.B25070?q=B25070&g=310XX00US33460.
- Rachel Ozer-Bearson Shazia Manji, “Pro-Housing Designation Programs: How States Are Incentivizing Pro-Housing Reform,” Terner Center for Housing Innovation, 2024, https://ternercenter.berkeley.edu/wp-content/uploads/2024/11/TernerCenterProHousingDesignationPrograms.pdf. Salim Furth Eli Kahn, “Breaking Ground: An Examination of Effective State Housing Reforms in 2023,” Mercatus Center at George Mason University, 2023, https://www.mercatus.org/research/policy-briefs/breaking-ground-examination-effective-state-housing-reforms-2023.
- Salim Furth Eli Kahn, “Breaking Ground.”
- Salim Furth Eli Kahn, “Breaking Ground.”
- “Support for Policies That Promote More Housing Crosses Geographic Lines,” Alex Horowitz and Tushar Kansal, The Pew Charitable Trusts, Jan. 31, 2024, https://www.pewtrusts.org/en/research-and-analysis/articles/2024/01/31/support-for-policies-that-promote-more-housing-crosses-geographic-lines. “Strong Support Across Partisan Lines for Policies That Boost Housing,” Tushar Kansal and Andy Winkler, The Pew Charitable Trusts, https://www.pewtrusts.org/en/research-and-analysis/articles/2024/05/29/strong-support-across-partisan-lines-for-policies-that-boost-housing.
- Trent Saunders and Peter Tulip, “A Model of the Australian Housing Market,” Reserve Bank of Australia, 2019, https://www.rba.gov.au/publications/rdp/2019/pdf/rdp2019-01.pdf.
- Based on a compilation of supply elasticity of housing price estimates from the United Kingdom and Australia. Trent Saunders and Peter Tulip, “A Model of the Australian Housing Market.”


How to Increase Housing Supply and Access to Safe Financing

Minneapolis Land Reform, a Blueprint for Housing Affordability

More Flexible Zoning Helps Contain Rising Rents


Survey Finds Majority Favor Policies to Enable More Housing
ADDITIONAL RESOURCES
Issue Brief


