Single-Family Home Sales in Philadelphia
What 20 years of city records tell us about how the market has changed

Editor’s note: Figures 1, 4, and 5 were updated on July 30, 2024, to include 2021 data.
Overview
For decades, Philadelphia has had a reputation for being a relatively affordable place to buy a home—at least when compared with New York, Boston, Washington, and some other major cities—a reputation that has held steady even in an era of rising home prices nationwide.
But after analyzing the nearly 700,000 single-family home sales that were recorded in the city from 2000 through 2021, The Pew Charitable Trusts has found that reports of Philadelphia’s housing affordability may be somewhat overstated.
Since 2000, Philadelphia’s housing market has been shaped by several factors, including gradual population growth after decades of decline, a property tax abatement that was implemented in 2000 and spurred new real estate investment, the market contraction following the 2006-08 national housing crash, and the subsequent years of low interest rates that attracted many new homebuyers. These factors have resulted in a reshaped housing market.
In 2021, the median price for a home sold in an arm’s-length transaction in Philadelphia was a relatively modest $208,000, according to deed records. (An arm’s-length transaction involves two independent parties with no prior relationship and excludes homes that were sold to or from a government entity or bank; transferred between family members; or sold for less than $100.) But that figure includes sales to investors, which tend to be lower priced than sales to traditional homebuyers. If sales to investors are excluded, the median price for a single family home rises to $265,000. And from 2000 through 2021, at least 32% of all home purchases in Philadelphia were made by investors.
The increased price of entry-level homes—which are defined here as the houses making up the least expensive 25% of home sales for any given year—also illustrates how Philadelphia’s housing market changed from 2000 through 2021. If inflation is taken into account, the median price of an entry-level single-family home in the city rose from $59,000 in 2000 (in 2021 dollars) to $160,000 in 2021—an increase of 171%. Mortgage interest rates were much lower in 2021 than in 2000, but not low enough to offset the price increase. Recent increases in interest rates have made these homes substantially less affordable for entry-level buyers—particularly those with the lowest incomes.
Other findings from Pew’s analysis of the Philadelphia housing market include:
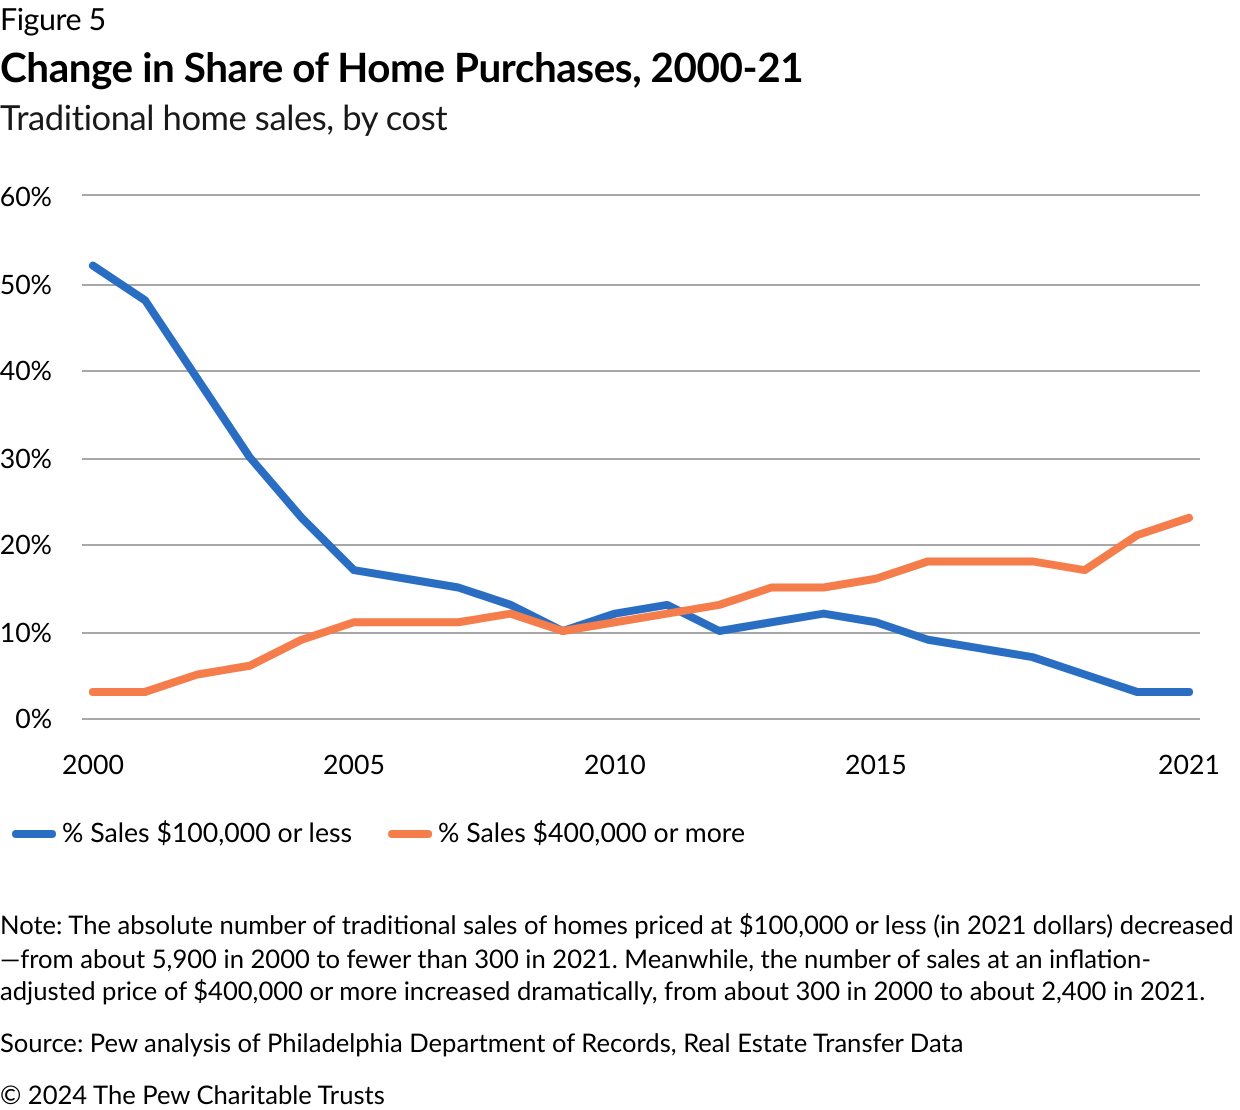
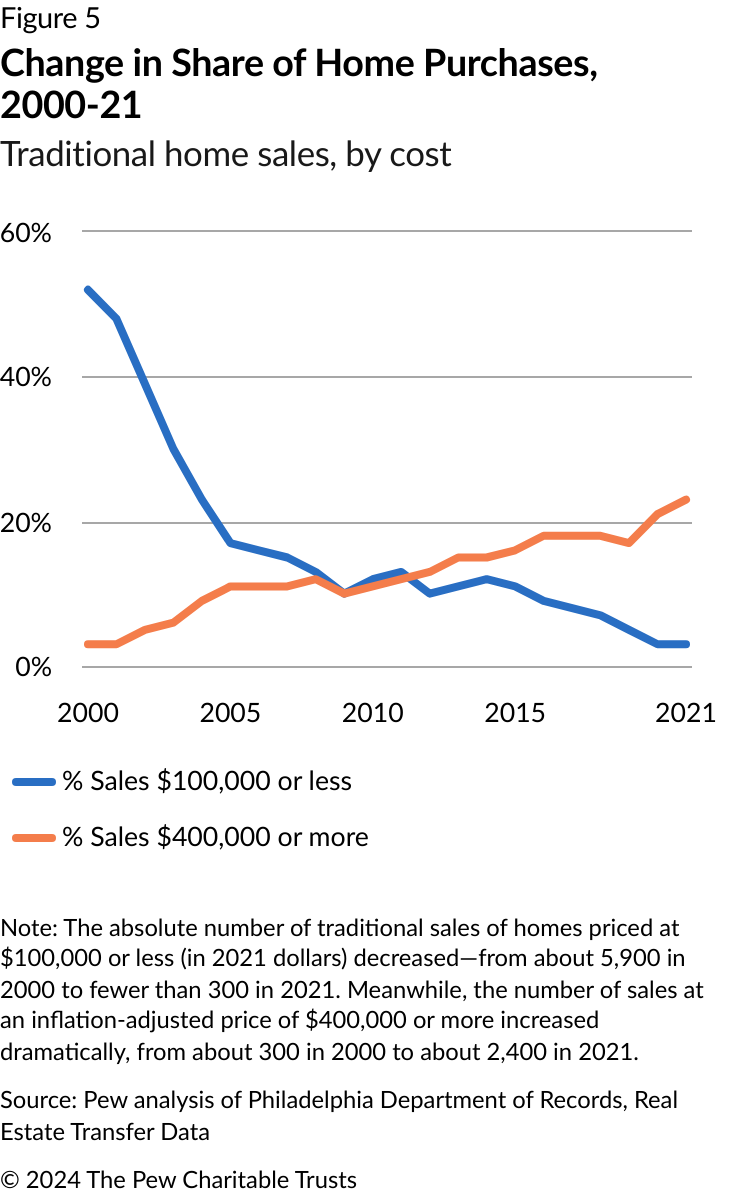
- From 2000 to 2021, the share of annual sales of low-cost homes—those priced at $100,000 or less in 2021 dollars—decreased, while the share of expensive homes increased. In 2000, low-cost homes accounted for 52% of all transactions made by “traditional” purchasers (those who used a mortgage to buy a place to live); in 2021, that figure was 3%. Among those same traditional buyers, home sales of $400,000 or more (in 2021 dollars) represented only 3% of all transactions in 2000. But in 2021, 23% of all traditional homebuyers paid $400,000 or more.
- The share of entry-level homes sold dropped in neighborhoods surrounding Center City, such as Point Breeze and Fishtown. However, sales of low-cost homes increased in parts of Upper North and Lower Northeast Philadelphia, indicating that these areas became more affordable in relation to other neighborhoods than they had been in 2000.
- Home prices increased in every neighborhood, but household incomes did not keep pace. Total monthly mortgage costs (including property taxes and insurance) for an entry-priced home increased 55% from 2000 to 2021, while the city’s median income rose only 10% when adjusted for inflation. As a result, the share of Philadelphia households that could afford an entry-priced home dropped from 70% in 2000 to 58% in 2021. For the purposes of this report, entry-level sales are transactions priced in the bottom 25% of traditional home sales in a given year; an entry-level home is one that falls within that price range. The entry price refers to the median price of a home in that bottom 25%.
- Homeownership rates fell. Over the two decades examined in this study, the homeownership rate in Philadelphia fell from 59% to 53%, largely because the city added rental units, while the number of owner occupied homes remained essentially unchanged.
- The composition of the city’s homeowners and mortgage borrowers changed. Philadelphia had more Asian and Hispanic homeowners in 2021 than in 2000. And, controlling for inflation, more homeowners had incomes above $100,000. But there were fewer White and Black homeowners in 2021, and fewer homeowners with incomes below $100,000 (again, after controlling for inflation).
- The number of Asian, Hispanic, and high-income borrowers receiving mortgages increased dramatically in the 22 years examined in this study, while the number of lower-income borrowers fell markedly. Although the number of Black homeowners was down only slightly (about 1%), the number of Black Philadelphians getting mortgages fell by 25%.
Understanding these nuances helps create a more complete picture of the home purchasing market in Philadelphia, which is working well for some but not for all.
Terms used in this report
This report focuses on homes that were sold in arm’s-length transactions, in which both parties work in their own self-interest—which should result in a fair market price.
Traditional home sales involve properties that were sold in arm’s-length transactions and purchased by what this report calls traditional homebuyers—individuals who bought the house for their own occupancy, using a mortgage. This class of sales excludes properties purchased by businesses, nonprofit entities, and individuals who acquired more than two homes during the analysis period. It also excludes all cash purchasers.
To be clear, there is no generally accepted definition for an entry-level home. Rather than focus on a specific size or style of home, or on first-time buyers, this report uses the 25% threshold to approximate the lowest price range at which someone buying a home might reasonably expect to enter the Philadelphia housing market.
Characteristics of Philadelphia’s housing market
Housing sales volume
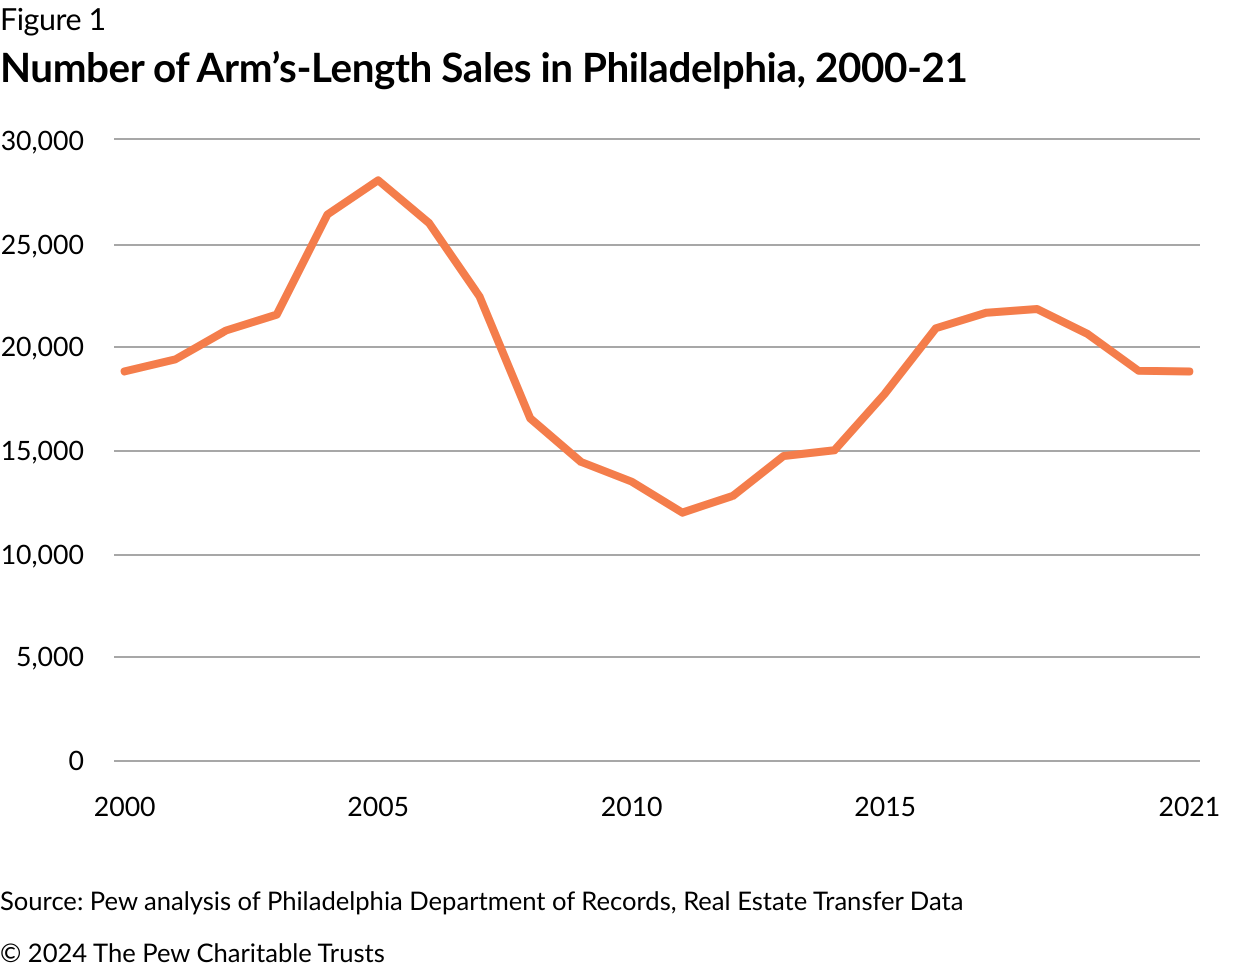
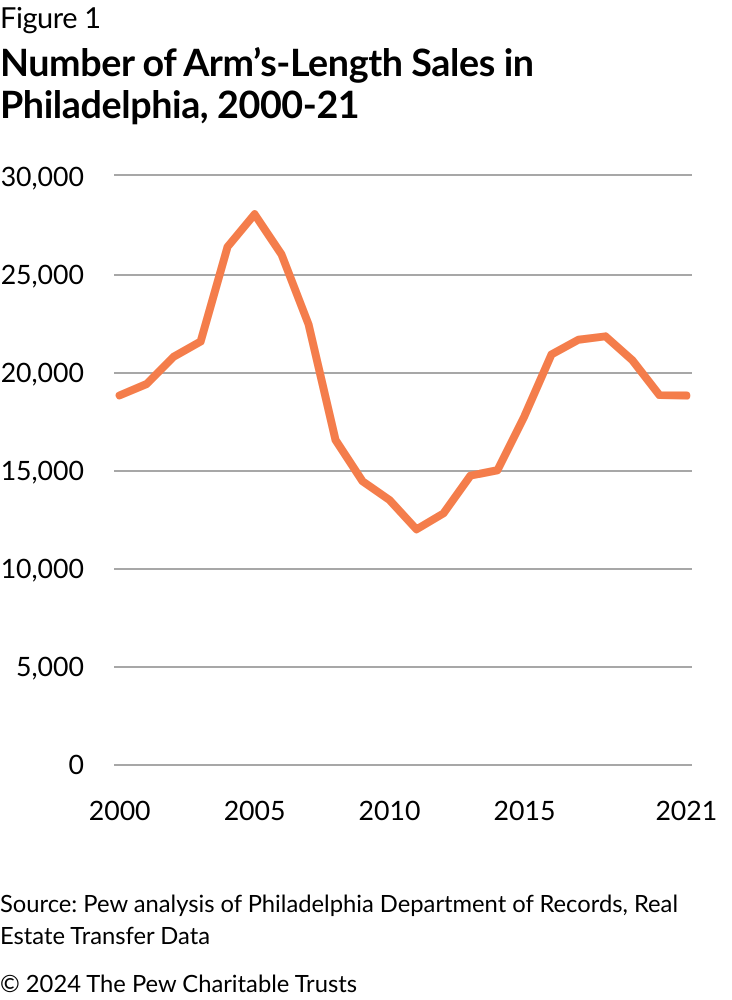
From 2000 through 2021, an annual average of 32,000 single-family residential properties changed hands in Philadelphia.1 Records of deed transactions show that property transfers peaked at 45,000 in 2005, at the height of the national housing bubble, and dropped to a low of 22,000 in 2011, following the collapse of the American housing market.
But only about 61% of those transactions—an average of about 19,000 a year—were made at arm’s length. (See Figure 1.)
Location of arm’s-length sales
From 2000 through 2021, sales volumes were highest in Center City, Eastern North Philadelphia, and several other areas. (See Figure 2.) These parts of the city recorded more than 100 arm’s-length sales transactions for every 100 single-family residential parcels. The Graduate Hospital neighborhood, in Center City, had the highest sales activity over the period studied, with more than 150 transactions per 100 residential parcels. The rate of transactions was lower in portions of North and West Philadelphia, where there were fewer than 75 home sales per 100 single-family parcels. Sales volumes shifted geographically throughout the period studied; for example, the Lower Northeast had a particularly active housing market from 2000 to 2005 but fewer transactions from 2016 to 2021. (See Appendix A.)

Types of homebuyers
There are three categories of homebuyers involved in arm’s-length sales of single-family homes.
The first category, traditional homebuyers, accounted for 53% of such sales in Philadelphia from 2000 through 2021. (See Figure 3.)
Purchasers in the second category—corporations and investors—accounted for 32% of all arm’s-length sales in the period analyzed by this study.2 This proportion has remained relatively stable over time, moving within the 28% to 36% range since 2002; the percentage was lower in 2000 and 2001. In this analysis, purchasers were considered investors if they included designations such as “LLC,” “realty,” or a property address in their names. Individuals who purchased more than two homes were classified as investors.3
The third category is individual cash purchasers. This group, 16% of all buyers, is a mixture of small investors and homeowners who were able to purchase a home without a mortgage; it’s not possible to determine the precise nature of that mix. In recent years, there has been an increase nationally in prospective homeowners using cash to buy market-rate properties in tight markets.4 But this type of increase does not appear to have happened in Philadelphia.5

Two distinct housing markets
Most discussions of the housing market in Philadelphia include analysis of all arm’s-length sales. And to some extent, this report does as well. But as noted above, 53% of all arm’s-length purchasers are traditional homebuyers, while at least 32% are investors. Those different types of buyers operate in two distinct markets, and those markets have different pricing structures.
Based on data from the Philadelphia Department of Records, the median home value for arm’s-length single family home sales in 2021 was $208,000. But once investors and traditional buyers are separated, a more accurate picture of affordability emerges. The median price for traditional buyers in 2021 was $265,000, while the median price for investors was $100,000.
The ratio of the prices paid by traditional buyers to those paid by investors has been similar throughout the 22-year study period—with a $186,000 median price for traditional buyers (in 2021 dollars) and a median price of $63,000 for investors.
From this point forward, analysis of Philadelphia home sales in this report will focus on traditional home sales—that is, the universe of properties that were purchased by traditional homebuyers in arm’s-length, market-rate transactions using a mortgage.
Change in sale prices
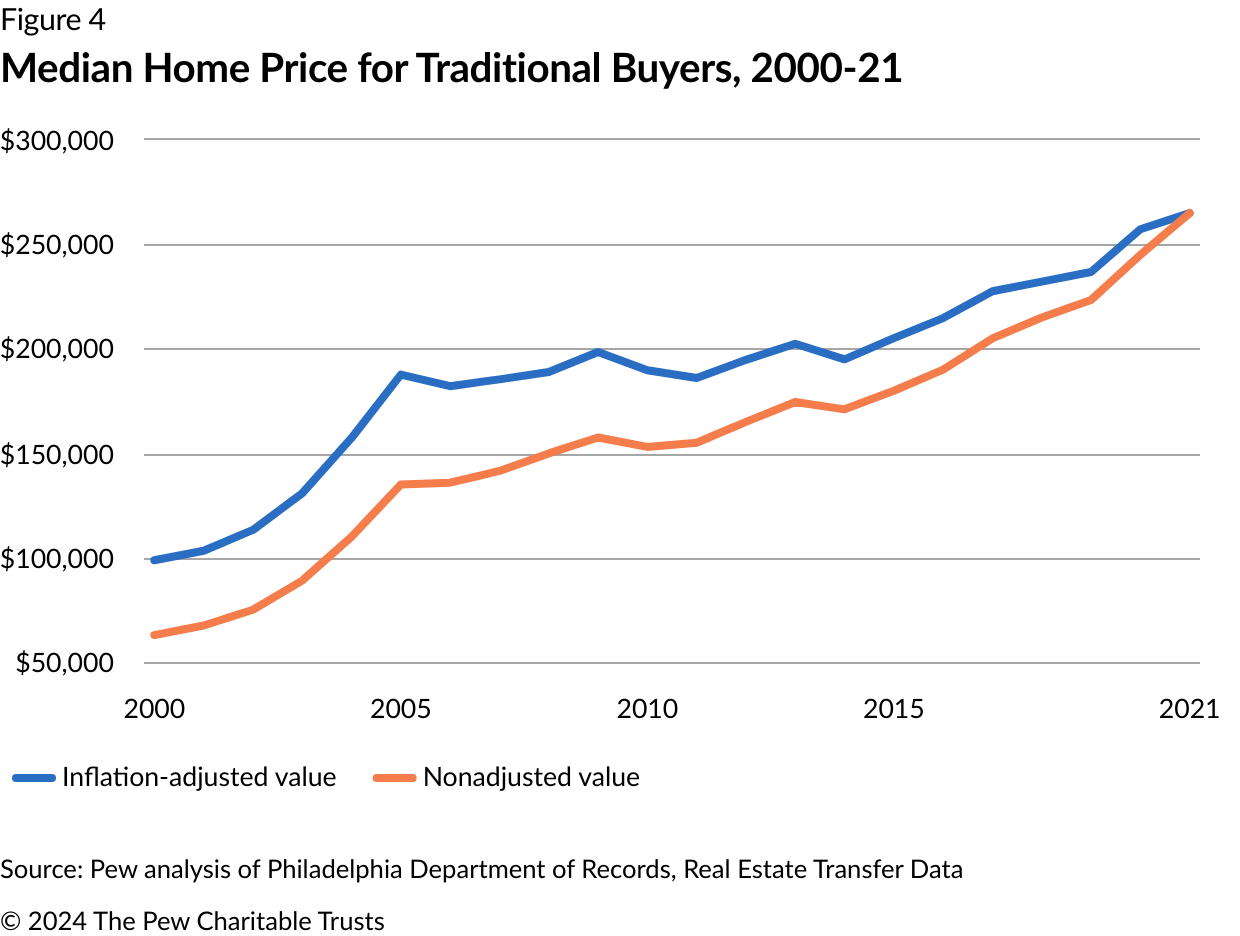
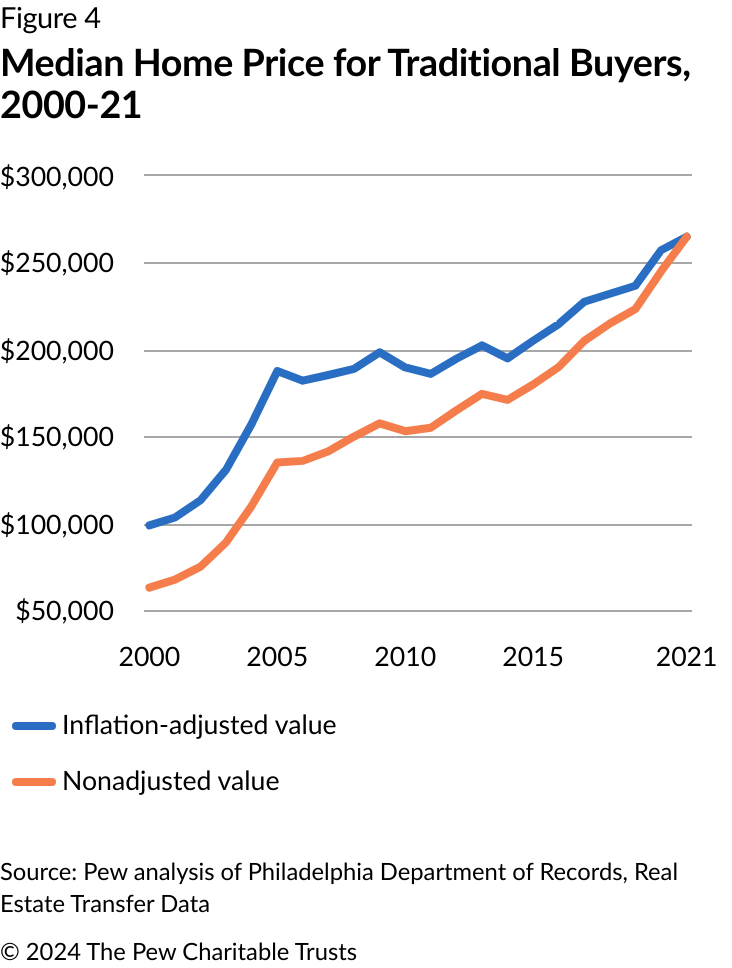
As shown in Figure 4, the median sale price for traditional homebuyers in Philadelphia rose from $99,000 in 2000 (when adjusted for inflation) to $265,000 in 2021, an increase of 168%. (See Figure 4.)
The increase was fueled by a decrease in the number of traditional home sales below $100,000 in 2021 dollars and an increase in the number that cost more than $400,000.6 In 2000, 52% of all homes sold to traditional buyers cost $100,000 or less (in 2021 dollars). But that share dropped to 12% in 2010 and to 3% in 2021. Meanwhile, homes priced above $400,000 represented only 3% of all sales in 2000, 11% in 2010, and 23% in 2021. (See Figure 5.)
Entry-level homes
As shown in Table 1, below, 1 in 4 traditional homebuyers in Philadelphia paid $198,000 or less for a home in 2021. Pew’s analysis considers these buyers—those who purchased a home in the bottom quartile of all home sales—to be entry-level buyers. Those individuals paid a median price of $160,000 to purchase a home in 2021.
Table 1
Prices Paid by Traditional Homebuyers in Philadelphia, 2021
| Lowest quartile | Second quartile | Third quartile | Highest quartile | |
|---|---|---|---|---|
| Bottom 25th percentile of home sale prices | 26th to 50th percentile of home sale prices | 51st to 75th percentile of home sale prices | 76th to 100th percentile of home sale prices | |
| Range | ≤ $198,000 | > $198,000 to $265,000 | > $265,000 to $360,000 | > $360,000 |
| Median | $160,000 | $235,000 | $301,000 | $490,000 |
Source: Pew analysis of Philadelphia Department of Records, Real Estate Transfer Data
Figure 6 shows the location of entry-level home sales in the city since 2000—in terms of the number of sales per residential parcel in each census tract. By that measure, purchases of entry-level homes were most prevalent in Lower Northeast Philadelphia, where at least 20 homes were sold to a traditional entry-level buyer for every 100 single-family homes in the area.7 These areas with the most entry-level home sales are depicted in the darkest shade. Sales of entry-level homes were also a significant component of the housing market in parts of West and Southwest Philadelphia, as well as many Upper North Philadelphia neighborhoods.
Entry-level home purchases were less common in Northwest Philadelphia, the Far Northeast, and Center City. In those parts of the city, traditional homebuyers typically paid $300,000 to $400,000 for the lowest-cost homes.
In the last six years of the analysis period (2016-21), entry-level homes were available in many of the same parts of the city as in the first six (2000-05). But the number of entry-level homes available decreased in some neighborhoods while increasing in others. Figure 7 shows the change in the number of home sales that qualified as entry level in each census tract. The volume decreased in the areas shown in the darkest shade of orange, including neighborhoods such as Fishtown and Point Breeze, which experienced increased investment over the analysis period.8
In the areas shaded dark green, entry-level homes made up a larger share of traditional home purchases than they did in the early 2000s. These areas include census tracts in Olney, Oxford Circle, West Oak Lane, and Wynnefield, indicating that these traditionally middle-market areas became more affordable relative to other Philadelphia neighborhoods.9 To be sure, home prices in these neighborhoods did rise, but to a lesser degree than in other areas. In fact, inflation-adjusted figures show that every neighborhood in the city experienced home price appreciation during the analysis period.
The Impact of Interest Rates on Housing Costs
From 2000 to 2021, mortgage interest rates dropped to unprecedented lows, a factor that contributed to rising home prices in Philadelphia and throughout the nation. Pew’s analysis of entry-level mortgage costs shows that lower mortgage rates offset some but not all of those rising prices, which also stemmed from other factors—including a nationwide housing shortage.
As shown in Table 2, an individual purchasing an entry-priced home in 2021, with a historically low interest rate of 3.28%, had a monthly mortgage payment of about $944 (including property taxes and insurance). That total was 55% higher than what the payment for an entry-priced home acquired in 2000 would have been, if adjusted for inflation ($608 in 2021 dollars).
Household incomes, on the other hand, rose more slowly. Philadelphia residents’ median household income increased about 10% from 2000 to 2021, when adjusted for inflation. According to Pew estimates, about 58% of Philadelphia households had incomes high enough to purchase an entry-priced home in 2021, down from 70% in 2000.
Table 2
Mortgage Costs for Entry-Priced Homes in Philadelphia
Figures adjusted for inflation
| Purchase price (in 2021 dollars) | Interest rate | Mortgage payment (in 2021 dollars) | |
|---|---|---|---|
| 2000 | $59,000 | 8.94% | $608 |
| 2010 | $103,000 | 5.21% | $750 |
| 2021 | $160,000 | 3.28% | $944 |
| 2023 | $142,000 | 7.56% | $1,213 |
| Change from 2000 to 2021 | +171% | +55% |
Notes: 2023 data is shown to illustrate the impact of recent mortgage rate increases. Mortgage payment estimates include property taxes and insurance costs. Mortgage interest rates were adjusted to reflect higher average interest rates in Philadelphia. According to Pew’s analysis of Home Mortgage Disclosure Act data, interest rates in the city are, on average, 11% higher than rates paid by mortgage borrowers in other parts of the U.S. Dollars are adjusted for inflation.
Sources: Pew analysis of Philadelphia Department of Records, Real Estate Transfer Data; interest rates from Freddie Mac Primary Mortgage Market Survey, adjusted
In 2022, sale price growth slowed nationally as the Federal Reserve Bank initiated a series of interest rate hikes to slow inflation.10 Mortgage rates rose dramatically that year and in 2023, reaching a 22-year high of 7.79% in October 2023.11 If mortgage rates remain high or home prices do not come down, there may be a lasting impact on housing affordability.
Philadelphia Department of Records data shows that home prices in the city are responding to rising interest rates: The median price for an entry-level home decreased from $160,000 in 2021 to $142,000 in 2023. But that was not enough to offset high interest rates, resulting in higher monthly mortgage payments.
How homeownership in Philadelphia has changed
Philadelphia has a decades-long track record of high homeownership levels among its Black, Hispanic, and low to-moderate-income households. Given the significant increases in home prices throughout the city and the steep decline in low-cost home sales over the 22 years covered in this study, Pew sought to examine the degree to which access to homeownership for the city’s low- and moderate-income households has changed. Pew used mortgage origination data to show which demographic groups have been able to secure mortgages in recent years and census data to explore how changes over the past two decades have reshaped the demographic profile of the city’s homeowners.
Mortgage originations by income
As might be expected in light of the dramatic rise in home prices from 2000 to 2021, recent mortgage borrowers in Philadelphia have higher incomes than those who took out loans two decades ago. In 2000, high-income households—those with annual incomes above $100,000 in 2021 dollars—took out less than half as many mortgages as households with low or moderate incomes. From 2000 to 2021, the number of high-income households receiving mortgages nearly doubled. Lending to households with incomes below $50,000 (in 2021 dollars), however, dropped markedly—down 33% from 2000 levels. By 2021, only 25% of all borrowers in the city fell into this income group—down from 41% in 2000. (See Table 3.) During this time span, the number of Philadelphia households with incomes above $100,000 increased 43%; population growth among households with lower incomes was far more modest.12
Household incomes below $50,000 are not uncommon in Philadelphia. In 2022, the city’s median household income was nearly $57,000—meaning that half of all households in the city had incomes less than that. Median incomes were higher for White households in the city ($81,000) and lower for Black and Hispanic households (about $43,000 for both groups). The median household income for Asian households was $62,000.
Table 3
Mortgage Originations by Income Group in Philadelphia, 2000-21
Incomes adjusted for inflation
| 2000 | 2021 | Change, 2000-21 | ||||
|---|---|---|---|---|---|---|
| Income group | Total originations | % | Total originations | % | Numerical change | Percentage change |
| Income < $50,000 | 5,630 | 41% | 3,800 | 25% | -1,830 | -33% |
| Income $50,000 to $100,000 | 5,710 | 41% | 6,770 | 45% | +1,060 | +19% |
| Income > $100,000 | 2,430 | 18% | 4,520 | 30% | +2,090 | +86% |
| Total originations | 13,770 | 100% | 15,090 | 100% | +1,320 | +10% |
Source: Home Mortgage Disclosure Act
Mortgage originations by race and ethnicity
Home borrowers were also more ethnically diverse in 2021 than they were 21 years earlier. The number of Asian borrowers rose 157% in that period, while 48% more Hispanic borrowers received loans in 2021 than they did in 2000. The number of White borrowers increased modestly, by 8%.
Conversely, the number of mortgages issued to Black households dropped 25%—during a period when the number of Black residents in the city remained relatively unchanged—making them the only racial or ethnic group to have fewer mortgages originated in 2021 than in 2000. (See Table 4.)
Several factors appear to be shaping those changes. Multiple analyses of mortgage lending trends in Philadelphia have shown that Black borrowers persistently face higher mortgage denial rates than applicants from other racial and ethnic groups.13 At the same time, mortgage denial rates for all borrowers have gone down over the past two decades. Also down are the rates at which households of all races apply for mortgage financing. An analysis by the Delaware Valley Regional Planning Commission found that the number of Black residents applying for mortgages in Philadelphia fell 64% from 2005 to 2019—more than any other racial or ethnic group.14
Housing Mortgage Disclosure Act data indicates that in 2021, Black applicants submitted 18 mortgage applications for every 1,000 Black households in Philadelphia. The application rates per 1,000 households for Asian, Hispanic, and White households were 51, 29, and 34, respectively. (See Table 5.) It is unclear why Black residents have sought home financing less frequently than members of other racial and ethnic groups, but limited credit access among Black households is well documented.15
Table 4
Mortgage Originations by Race in Philadelphia, 2000 and 2021
| 2000 | 2021 | Change, 2000-21 | ||||
|---|---|---|---|---|---|---|
| Race | Total originations | % | Total originations | % | Numerical change | Percentage change |
| Asian | 600 | 4% | 1,540 | 10% | +940 | +157% |
| Black | 4,030 | 29% | 3,040 | 20% | -990 | -25% |
| Hispanic | 1,160 | 8% | 1,720 | 11% | +560 | +48% |
| White | 6,010 | 44% | 6,520 | 43% | +510 | +8% |
| Other races | 1,980 | 14% | 2,270 | 15% | +290 | +15% |
| Total originations | 13,780 | 100% | 15,090 | 100% | +1,310 | +10% |
Notes: The “other races” category includes mortgage recipients who identified as Native American, Alaska Native, Native Hawaiian, or mixed race, or who did not provide a racial or ethnic designation to their mortgage lender. Members of mixed-race households who applied for a mortgage jointly are also included in the other races category.
Source: Home Mortgage Disclosure Act
Table 5
Mortgage Applications in Philadelphia per 1,000 Households, 2000 and 2021
By race and ethnicity
| Race | 2000 | 2021 | Percentage change (2000-21) |
|---|---|---|---|
| Asian | 42 | 51 | +21% |
| Black | 26 | 18 | -31% |
| Hispanic | 43 | 29 | -33% |
| White | 28 | 34 | +21% |
| Total | 36 | 33 | -8% |
Source: Home Mortgage Disclosure Act
Homeownership by income
In 2000 and 2021, the number of Philadelphia households that owned their own homes was virtually identical—approximately 349,000 in 2000 and 350,000 in 2021. But homeownership in the city was far from stable over the course of this time span. From 2000 through 2010—a period that included the housing market crash—the city lost roughly 38,000 homeowners; it then added 39,000 in the subsequent decade.
From 2000 to 2021, the number of households in the city increased from 590,000 to 661,000, with nearly all of the new households being renters.16 As a result, Philadelphia’s homeownership rate dropped from 59% to 53%. (See Table 6.)
As shown in Table 7, declines in homeownership from 2000 to 2010 were relatively evenly distributed among households of all incomes, while homeowner gains after 2010 were concentrated among households with incomes over $100,000, controlled for inflation. From 2010 to 2021 alone, the city added 38,000 such high income homeowners—an increase of 52%.
In terms of raw numbers, no other income group in Philadelphia saw homeownership levels in 2021 match or exceed pre-recession levels. Homeownership among households with incomes from $50,000 to $100,000 fell by 13,000 from 2000 to 2021, despite there being 7,000 more such households in the city. This group is now the smallest income class of homeowners in the city, with 98,000; homeowners with incomes below $50,000 remain the largest, with 139,000.
Table 6
Total and Owner-Occupied Households in Philadelphia
2000, 2010, and 2021
| 2000 | 2010 | 2021 | Change, 2000-21 | |
|---|---|---|---|---|
| Total households | 590,000 | 575,000 | 661,000 | +71,000 (+12%) |
| Owner-occupied | 349,000 | 311,000 | 350,000 | +1,000 (0%) |
| Homeownership rate | 59% | 54% | 53% | -6 percentage points |
Source: Pew analysis of U.S Census Bureau, American Community Survey, IPUMS one-year estimates
Table 7
Homeownership by Income Group in Philadelphia (Inflation-Adjusted)
2000, 2010, and 2021
| 2000 | 2010 | 2021 | Change, 2000-21 | |
|---|---|---|---|---|
| Income < $50,000 | ||||
| Total households | 308,000 | 324,000 | 323,000 | +15,000 (+5%) |
| Owner-occupied | 150,000 | 137,000 | 139,000 | -11,000 (-7%) |
| Homeownership rate | 49% | 42% | 43% | -6 points |
| Income from $50,000 to $100,000 | ||||
| Total households | 171,000 | 154,000 | 178,000 | +7,000 (+4%) |
| Owner-occupied | 111,000 | 100,000 | 98,000 | -13,000 (-12%) |
| Homeownership rate | 65% | 65% | 55% | -10 points |
| Income > $100,000 | ||||
| Total households | 112,000 | 97,000 | 160,000 | +48,000 (43%) |
| Owner-occupied | 88,000 | 75,000 | 113,000 | +25,000 (28%) |
| Homeownership rate | 79% | 77% | 71% | -8 points |
Note: Household totals may be inconsistent with values reported in Table 6 due to rounding.
Source: Pew analysis of U.S Census Bureau, American Community Survey, IPUMS one-year estimates
Homeownership by race and ethnicity
Among racial and ethnic groups in Philadelphia, homeownership rose most markedly for Asian households—an increase of 238% from 2000 to 2021. The number of Hispanic homeowners rose 105%. Both groups represent a relatively small, but growing, share of city homeowners. In fact, Asian and Hispanic households were the only two groups that did not see a decline in homeownership during the 2007-09 recession and experienced continued growth in homeownership in the subsequent decade.
Homeownership levels decreased 5 percentage points among Black households. There were about 1,000 fewer owners in this category in 2021 than there were in 2000. The number of Black homeowners increased from 2010 to 2021, but not enough to completely offset losses in the previous decade.
The biggest drop in Philadelphia homeownership occurred among White households. There was a 12% decrease in the number of White households living in the city from 2000 to 2021, despite a slight increase in the 2010s. And the number of White homeowners fell by 23%. Over the two decades, the White homeownership rate declined by 9 percentage points. (See Table 8.)
Table 8
Change in Philadelphia Homeownership by Race
2000, 2010, and 2021
| 2000 | 2010 | 2021 | Change, 2000-21 | |
|---|---|---|---|---|
| White | ||||
| Total households | 283,000 | 245,000 | 250,000 | -33,000 (-12%) |
| Owner-occupied | 186,000 | 149,000 | 143,000 | -43,000 (-23%) |
| Homeownership rate | 66% | 61% | 57% | -9 points |
| Black | ||||
| Total households | 238,000 | 239,000 | 259,000 | 21,000 (+9%) |
| Owner-occupied | 130,000 | 121,000 | 129,000 | 1,000 (-1%) |
| Homeownership rate | 55% | 51% | 50% | -5 points |
| Hispanic | ||||
| Total households | 38,000 | 51,000 | 81,000 | 43,000 (+113%) |
| Owner-occupied | 19,000 | 22,000 | 39,000 | 20,000 (+105%) |
| Homeownership rate | 50% | 43% | 48% | -2 points |
| Asian | ||||
| Total households | 20,000 | 29,000 | 43,000 | 23,000 (+115%) |
| Owner-occupied | 8,000 | 14,000 | 27,000 | 19,000 (+238%) |
| Homeownership rate | 40% | 48% | 63% | +23 points |
| Other | ||||
| Total households | 11,000 | 12,000 | 28,000 | 17,000 (+155%) |
| Owner-occupied | 6,000 | 5,000 | 13,000 | 7,000 (+117%) |
| Homeownership rate | 55% | 42% | 46% | -8 points |
Note: Household totals may be inconsistent with values reported in Table 6 due to rounding
Source: Pew analysis of U.S Census Bureau, American Community Survey, IPUMS one-year estimates
Conclusion
Philadelphia’s housing market has long been seen as one that is affordable and accessible to home seekers across a wide range of incomes and racial groups. Although that reputation has not been altogether unwarranted—the median home sale price was $208,000 in 2021—it has never been quite that simple.
In 2021, a little more than half of all homes sold in arm’s-length transactions in Philadelphia wound up in the hands of traditional homebuyers financing their purchases through mortgages. At least a third of the homes purchased—many of them low-priced and in need of repair—were bought by investors. If investor sales are factored out, the median single-family home price comes in at $265,000, which is considerably less affordable. Over the last two decades, home prices, controlled for inflation, have risen in every neighborhood.
By 2010, in the early aftermath of the national housing bubble and resulting crash, the city’s median home prices were nearly twice what they had been in 2000. They continued to rise in the following decade.
As sales increased in the neighborhoods surrounding the city’s core, the number and proportion of homes priced below $100,000 citywide, once a hallmark of Philadelphia’s affordability, plummeted—putting homeownership out of reach for many of the city’s low- and moderate-income residents.
Black households, in particular, have had a difficult time securing homeownership in recent years; this group is the only racial or ethnic group to see a decrease in the number of mortgage originations since 2000. Both Black households and White households experienced a drop in the number of homeowners as well as in homeownership rates.
It’s hard to know for sure whether changes in the housing market and lending environment are influencing broader changes in the racial and income mix of Philadelphia homeowners, or if the demographic changes in homeownership are reflections of the changing demographic makeup of the city and a reduced interest in homeownership across the board.
Although Philadelphia’s housing market remains more affordable than those in other large East Coast cities, it is not as affordable and accessible as it once was—particularly for households with the lowest incomes.


Methodology
The primary data source for this analysis was the Philadelphia Department of Records’ Real Estate Transfer Data, which includes all deed and mortgage transfers that the department has recorded since December 1999. The dataset was downloaded from opendataphilly.com in July 2023.
Pew’s analysis includes all single-family residential properties that had deed transfers from 2000 through 2021. The city’s Office of Property Assessment record number was used to identify single-family residential properties. Condominiums were excluded from the analysis.
Defining sale types
Arm’s-length sales: A home sale was classified as an arm’s-length sale if it involved a deed transfer for at least $100, and it was not transferred between related parties. Excluded from this category were sales that involved a bank or the government as a buyer or seller as well as those that were transferred through a sheriff’s deed.
Traditional home sales: A transaction was classified as a traditional home sale if it involved a deed transfer, the buyer used a mortgage to purchase the home, and the buyer was not on record as having purchased more than two residential properties in the city from 2000 through 2021. A property was considered to have been purchased using a mortgage if a mortgage was recorded within 31 days following the deed transaction.
Entry-level home sales: A transaction was classified as an entry-level sale if its value was in the bottom 25% of all traditional homes sold in a given year.
Entry price: The median sales price of a home in the bottom 25% of home sales for a given year; an entry-priced home is one that sold for the median price.
Individual cash home sales: A transaction was classified as a cash sale if it was a deed transfer, the buyer did not take out a mortgage within 31 days, and the buyer purchased two or fewer homes in the city from 2000 through 2021. The count of sales per owner was based on sales to buyers with the same name and identical spelling.
Investor home sales: A transaction was classified as an investor or corporate sale if it was a deed transfer and the buyer’s name indicated that it was a business entity. Pew included roughly 200 keywords to isolate business names from those of individuals. Individual purchasers who bought three or more residential properties in Philadelphia from 2000 through 2021 were also classified as investors.
Mortgage payments
Pew’s estimated monthly mortgage payments for entry-level buyers used the following parameters:
- Mortgage term: 30 years
- Down payment: 3.5%
- Tax rate: 1.398% of assessed value annually
- Home insurance: $1,000 annually
Mortgage rates were derived from Freddie Mac national data. Analysis of actual interest rates for Philadelphia home purchasers using the Home Mortgage Disclosure Act Dataset shows that Philadelphia residents pay interest rates that are typically about 11% higher than the national average. Property tax figures do not include an adjustment for Homestead Act deductions, since the program was not in place in 2000 or 2010.
Mortgage applications and originations
This analysis uses Home Mortgage Disclosure Act data downloaded from the Federal Financial Institutions Examination Council (2018-21), the Consumer Financial Protection Bureau (2007-17), and the National Archives (2000-06). The analysis uses data on first-lien mortgage applications and originations for single-family, owner occupied homes. In addition to completed mortgage applications—cases where the lender approves or denies an applicant—this analysis includes data on applications that were incomplete or withdrawn by the applicant.
Inflation adjustments
All dollar figures, including sale prices and household incomes, were adjusted to 2021 dollars using the U.S. Bureau of Labor Statistics’ Consumer Price Index for All Urban Consumers, as reported by the Federal Reserve Bank of Minneapolis.17
Endnotes
- This analysis focuses on the sale of single-family structures. It does not include condominiums or properties built for multifamily occupancy.
- L. Katz and S. Bokhari, “Investors Are Buying Roughly Half as Many Homes as They Were a Year Ago,” Redfin, Feb. 15, 2023, https://www.redfin.com/news/investor-home-purchases-q4-2022/. A Redfin analysis of major U.S. metropolitan areas in 2022 found that investor activity in the Philadelphia area ranked 14th highest among the nation’s 40 largest metro areas, with 20% of all homes purchased by investors in the Philadelphia area, compared with 18% for all U.S. metro areas. The analysis identified investors based on the presence of one of 10 keywords in the owner’s name or address. It should be noted that these figures are for the region, not for the city.
- This does not include properties that may have been purchased in conjunction with another party. For example, if a married couple purchased homes individually, and then one jointly, each owner would be counted as having purchased only one property, and three separate owners would be identified: each spouse individually, plus a new owner consisting of both individuals in the couple.
- J. Jones-Gorman, “Homes Purchased by All-Cash Buyers: How Is This Trend Unfolding in the U.S. Real Estate Market?,” Staten Island Advance, Feb. 25, 2023, https://www.silive.com/business/2023/02/homes-purchased-by-all-cash-buyers-how-is-this-trend-unfoldingin-the-us-real-estate-market.html.
- E. Martinez, K. Schaul, and H. Shaban, “See How Many All-Cash Buyers Snagged Houses in Your Neighborhood,” The Washington Post, Feb. 9, 2024, https://www.washingtonpost.com/business/interactive/2023/all-cash-buyers-housing-market/. A Washington Post analysis of metropolitan areas found that the number of cash buyers in the Philadelphia region dropped 1% from 2017 to 2022. Of the 162 regions analyzed, 132 had either a percentage increase in cash buyers or no change.
- Among homes sold to traditional buyers since 2000, the median sale price was $96,251 for homes in the bottom price quartile and $398,520 for homes in the top quartile.
- Appendix B includes a map of the 11 broad subdivisions of the city of Philadelphia as defined by the U.S. Census Bureau. Appendix C shows more specific neighborhood boundaries within the city.
- E. Bowen-Gaddy, “3 Maps That Explain Gentrification in Philadelphia,” WHYY, March 14, 2018, https://whyy.org/articles/3-mapsexplain-gentrification-philadelphia/.
- Reinvestment Fund, “Philadelphia’s Middle Neighborhoods: Demographic and Market Differences by Race, Ethnicity, and Nation of Origin” (2017), https://www.reinvestment.com/wp-content/uploads/2022/02/ReinvestmentFund-Philadelphia-Middle-Neighborhoods- Brief.pdf. This 2017 Reinvestment Fund report lists Oxford Circle, West Oak Lane, Wynnefield, and Olney among the city’s middle neighborhoods.
- R. Siegel and K. Orton, “Mortgage Rates Rise Above 7 Percent as Fed Scrambles to Slow Economy,” The Washington Post, Oct. 27, 2022, https://www.washingtonpost.com/business/2022/10/27/mortgage-rates-7-percent/.
- Federal Reserve Bank of St. Louis, “Freddie Mac, 30-Year Fixed Rate Mortgage Average in the United States,” September 2023, https://fred.stlouisfed.org/series/MORTGAGE30US. Mortgage interest rates rose from 3.22% in January 2022 and peaked at 7.79% in October 2023, according to data from the Federal Reserve Bank of St. Louis. The last time rates surpassed the October 2023 peak was in October 2000, when the interest rate was 7.87%.
- The number of households in the city with incomes from $50,000 to $100,000 increased 4%, while the number with incomes below $50,000 grew by 5%.
- J. Whiton, T. Singleton, and L. Ding, “What’s Behind the Racial Homeownership Gap in Philadelphia” (Federal Reserve Bank of Philadelphia, 2021), https://www.philadelphiafed.org/-/media/frbp/assets/community-development/briefs/cdro-briefhomeownership2-final.pdf; Reinvestment Fund, “Mortgage Lending in Philadelphia: Key Take-Aways From the 2021 Home Mortgage Disclosure Act Data Release” (2022), https://www.reinvestment.com/wp-content/uploads/2022/10/Reinvestment-Fund_HMDA_2022.pdf; Delaware Valley Regional Planning Commission, “Barriers to Building Generational Wealth: Mortgage Lending Disparities in Philadelphia” (2021), https://www.dvrpc.org/reports/adr21022.pdf.
- Delaware Valley Regional Planning Commission, “Barriers to Building Generational Wealth.” Mortgage applications were down 49.5% for Hispanic applicants and 56.6% for White applicants. The study did not examine application rates for Asian households.
- K. Sweet, “Bank to Pay $31M for Avoiding Mortgages to Minorities, Largest Such Settlement in U.S. History,” PBS NewsHour, Jan. 12, 2023, https://www.pbs.org/newshour/economy/bank-to-pay-31m-for-avoiding-mortgages-to-minorities-largest-such-settlement-inu-s-history; N. Zucker, “Redlining Settlement Requires Philly Lender to Improve Mortgage Access in Communities of Color,” PhillyVoice, July 27, 2022, https://www.phillyvoice.com/redlining-philadelphia-lawsuit-trident-mortgage-racial-discrimination-racism; A. Abrams, “Lack of Credit Has Been a Huge Obstacle to Black Home Buyers. Now Some Lenders Are Trying to Fix That,” The Washington Post, Feb. 17, 2022, https://www.washingtonpost.com/business/2022/02/17/lack-credit-has-been-huge-obstacle-black-home-buyers-now-somelenders-are-trying-fix-that; K. Broady, M. McComas, and A. Ouazad, “An Analysis of Financial Institutions in Black-Majority Communities: Black Borrowers and Depositors Face Considerable Challenges in Accessing Banking Services” (Brookings Institution, 2021), https://www.brookings.edu/articles/an-analysis-of-financial-institutions-in-black-majority-communities-black-borrowers-and-depositors-faceconsiderable-challenges-in-accessing-banking-services.
- From 2000 to 2021, the city of Philadelphia issued permits for the construction of more than 77,000 residential housing units, according to the U.S. Census Bureau, “Building Permit Survey,” https://www2.census.gov/econ/bps/Master%20Data%20Set/.
- Federal Reserve Bank of Minneapolis, “Inflation Calculator,” https://www.minneapolisfed.org/about-us/monetary-policy/inflation-calculator.


ADDITIONAL RESOURCES

Press Releases & Statements

Article


