Successful Retirement Systems Offer a Roadmap for Other States
A review of proven practices to improve fiscal management, ensure security, and boost transparency

Overview
State and local retirement systems aim to balance multiple goals: providing plans that support government workforce objectives and ensuring that the cost of benefits is stable and sustainable over the long term, all while putting workers on a pathway to retirement security. However, after the financial market crash of 2008 and ensuing Great Recession led to devastating investment losses for state retirement systems that were already weakened by previous underfunding, most states were off track for meeting those goals.
Policy reforms and economic considerations have improved most retirement systems’ cash flow situation in the years since. Yet only a handful of states have been able to deliver stability and sustainability—amid economic ups and downs—while meeting workers’ retirement security needs. As part of its nearly 20 years of research on public retirement systems, The Pew Charitable Trusts examined these standout states to identify a framework of best practices for system design and management.
Although the leading systems differ in their benefit designs, they share several exemplary characteristics, including a path to retirement security for all workers within defined cost targets, a plan for managing risk, and a commitment to ensuring that policies are transparent and clearly communicated to stakeholders. The following four practices form the core of these states’ success. Pew’s framework includes these key practices as well as metrics for evaluating states’ success in implementing them:
- Offer benefits that give workers a path to retirement security, as demonstrated by:
- Replacement income ratio—the share of workers’ preretirement take-home pay replaced by retirement benefit—of at least 90%.
- Savings rate—the share of their annual salary that workers who leave a public job can take with them—of at least 10% for workers with Social Security coverage and at least 18% for those without.
- Fund pension obligations sustainably so that costs are predictable and affordable for government budgets, as demonstrated by:
- Net amortization—the amount of money needed to pay for new benefits earned by current employees in a given year and to cover interest on the plan’s debt at the start of the same year—held stable or reduced by employer contributions.
- Operating cash flow ratio—the amount by which benefit payments exceed contributions as a percentage of plan assets—above -5%.
- Historical contribution volatility—the difference between highest and lowest employer contributions from 2008 to 2022—within plus or minus 3% of payroll.
- Employ risk-management policies that plan for economic and demographic uncertainty, as demonstrated by:
- Use of stress testing tools to assess the effects of investment risk on plan balance sheets and government budgets—and public reporting of the results.
- Normal cost sensitivity—expected volatility of employer costs for future benefits under a low return scenario—kept low through the use of risk-sharing features.
- Make benefit, funding, and investment policies, their implementation, and their performance fully transparent to all stakeholders, as demonstrated by:
- Fee disclosures that reflect the returns net of fees—that is, adjusted to account for fees paid to investment managers.
- Making investment policy statements—which outline objectives, risk parameters, and asset allocations—publicly available online.
Pew applied each metric to all 50 states but not necessarily to every retirement system within each state because of varying data availability and quality. Overall, however, these metrics cover approximately 90% of public retirement assets nationwide. See the methodological appendix for more information.
This brief provides more detail on this framework and then applies it to evaluate all 50 states to help identify states that are on a solid path and provide a roadmap for other states to improve their retirement systems.


Table 1
Which States Meet the Criteria of a Model Retirement System?
Framework implementation as measured by key metrics
| Retirement security | Fiscal sustainability | Planning for uncertainty |
Investment transparency |
||||||
|---|---|---|---|---|---|---|---|---|---|
| Replacement income ratio |
Savings rate |
Net amortization |
Operating cash flow |
Historical contribution volatility |
Risk reporting |
Normal cost sensitivity | Fee disclosures |
Investment policy statement | |
| AL | No | No | Yes | Yes | No | No | High | No | Yes |
| AK | No | Partial | Yes | Yes | No | No | Low | Yes | Yes |
| AZ | Yes | Yes | Yes | Yes | No | Yes | Mid | Yes | Yes |
| AR | Yes | No | Yes | Yes | Yes | No | High | Partial | Partial |
| CA | Partial | No | Yes | Yes | No | Yes | High | Yes | Yes |
| CO | No | Yes | Yes | Yes | No | Yes | Mid | Yes | Yes |
| CT | Partial | No | Yes | Yes | No | Yes | Mid | Yes | Yes |
| DE | Yes | No | Yes | Yes | No | Yes | High | No | Yes |
| FL | No | No | Yes | Yes | No | No | High | Yes | Yes |
| GA | Yes | Partial | Yes | Yes | No | No | Mid | Partial | Partial |
| HI | Yes | No | Yes | Yes | No | Yes | High | No | Yes |
| ID | Yes | No | Yes | Yes | Yes | No | Mid | No | Yes |
| IL | Partial | No | No | Yes | No | Yes | High | Yes | Yes |
| IN | No | No | Yes | Yes | No | Yes | Mid | Yes | Yes |
| IA | Yes | Yes | Yes | Yes | No | No | Mid | Yes | Yes |
| KS | No | No | Yes | Yes | No | Yes | Low | Yes | Yes |
| KY | Partial | No | Yes | Yes | No | No | Low | Partial | Yes |
| LA | No | No | Yes | Yes | No | No | High | No | Yes |
| ME | Partial | No | Yes | Yes | No | Yes | Mid | Yes | Yes |
| MD | Yes | No | Yes | Yes | No | No | Mid | Yes | Yes |
| MA | No | No | Yes | Yes | No | No | High | No | Yes |
| MI | No | Yes | Yes | Yes | No | No | Low | Yes | Yes |
| MN | Yes | No | Yes | Yes | Yes | Yes | High | Yes | Yes |
| MS | Yes | No | Yes | Yes | No | Yes | High | No | Yes |
| MO | Yes | No | Yes | Yes | No | Yes | High | Partial | Yes |
| MT | Yes | Partial | Yes | Yes | No | Yes | High | Yes | Yes |
| NE | Yes | Partial | Yes | Yes | Yes | No | Mid | Yes | Yes |
| NV | Yes | No | Yes | Yes | No | No | Mid | No | Yes |
| NH | Yes | No | Yes | Yes | No | No | High | Yes | Yes |
| NJ | Yes | No | Yes | Yes | No | Yes | High | Yes | No |
| NM | Yes | Yes | No | Yes | No | No | Mid | Yes | Yes |
| NY | Yes | No | Yes | Yes | No | No | Mid | Partial | Yes |
| NC | Yes | No | Yes | Yes | No | Yes | Mid | Yes | Yes |
| ND | Yes | Partial | Yes | Yes | No | Yes | Mid | Yes | No |
| OH | No | Partial | Yes | Yes | No | Yes | High | Yes | Partial |
| OK | Partial | Partial | Yes | Yes | No | No | Mid | Partial | Yes |
| OR | Yes | No | Yes | Yes | No | Yes | Mid | Yes | Yes |
| PA | Partial | Yes | Yes | Yes | No | Yes | Low | Yes | Yes |
| RI | Yes | No | Yes | Yes | No | No | Low | Yes | Yes |
| SC | Yes | No | Yes | Yes | No | No | High | Yes | Yes |
| SD | Yes | Yes | Yes | Yes | Yes | Yes | Low | Yes | Yes |
| TN | Yes | Yes | Yes | Yes | Yes | No | Low | Yes | Yes |
| TX | Partial | No | Yes | Yes | No | Yes | Mid | Partial | Yes |
| UT | No | No | Yes | Yes | No | No | Low | No | No |
| VT | Yes | No | Yes | Yes | No | No | High | Yes | Yes |
| VA | No | No | Yes | Yes | No | Yes | Mid | Yes | Yes |
| WA | Partial | No | Yes | Yes | No | Yes | High | Yes | Yes |
| WV | Yes | No | Yes | Yes | No | No | High | Yes | Partial |
| WI | Yes | Yes | Yes | Yes | Yes | Yes | Low | Yes | Yes |
| WY | Yes | No | Yes | Yes | No | No | High | Yes | Yes |
Notes: Replacement income rate, the savings rate, and normal cost sensitivity data includes only 81 state retirement systems that cover teachers and state workers. The three fiscal sustainability metrics are based on aggregated data for all state retirement systems. The metrics under “investment transparency” include the nation’s 73 largest funds. “Partial” refers to instances in which at least one, but not all systems in a state meet the criteria. For normal cost sensitivity, “low” indicates that the system has built-in risk-sharing features, “mid” indicates a limited or partial distribution of risk, and “high” indicates that the system does not have a plan for sharing unexpected risk.
Source: Pew’s analysis of state public employee and teacher retirement systems
Offer benefits that give workers a path to retirement security
Retirement benefits are critical to governments’ ability to attract and retain skilled workforces. In Pew’s survey of state and municipal employees, respondents said that these benefits are a key factor when they choose whether to take jobs—and remain—in public service.1 Survey participants also indicated that they generally expect the public sector to provide better retirement packages than the private sector.2 Similarly, an analysis by the Rand Corp. found that retirement plan designs affect workers’ decisions to stay with or separate from state employment.3
Metrics
Pew uses two main metrics, the replacement income ratio and the savings rate, to assess the quality of the benefits that public retirement systems provide. The replacement income ratio measures how much income career workers—those who spend most or all of their careers employed in the public sector—can expect in retirement as a share of the take-home pay they received in their final year of employment.4
The savings rate calculates how much money, expressed as a percentage of annual salary, employees who leave their public-sector jobs before reaching retirement eligibility can withdraw from their pension funds when they depart.5 Employees typically have access to their own contributions—the funds taken from their paychecks—to the retirement plan and the compounded interest on those funds, but in some cases, they can also withdraw some or all of the employer contributions made on their behalf.
Pew calculated both metrics for 81 state and teacher retirement systems across the country.
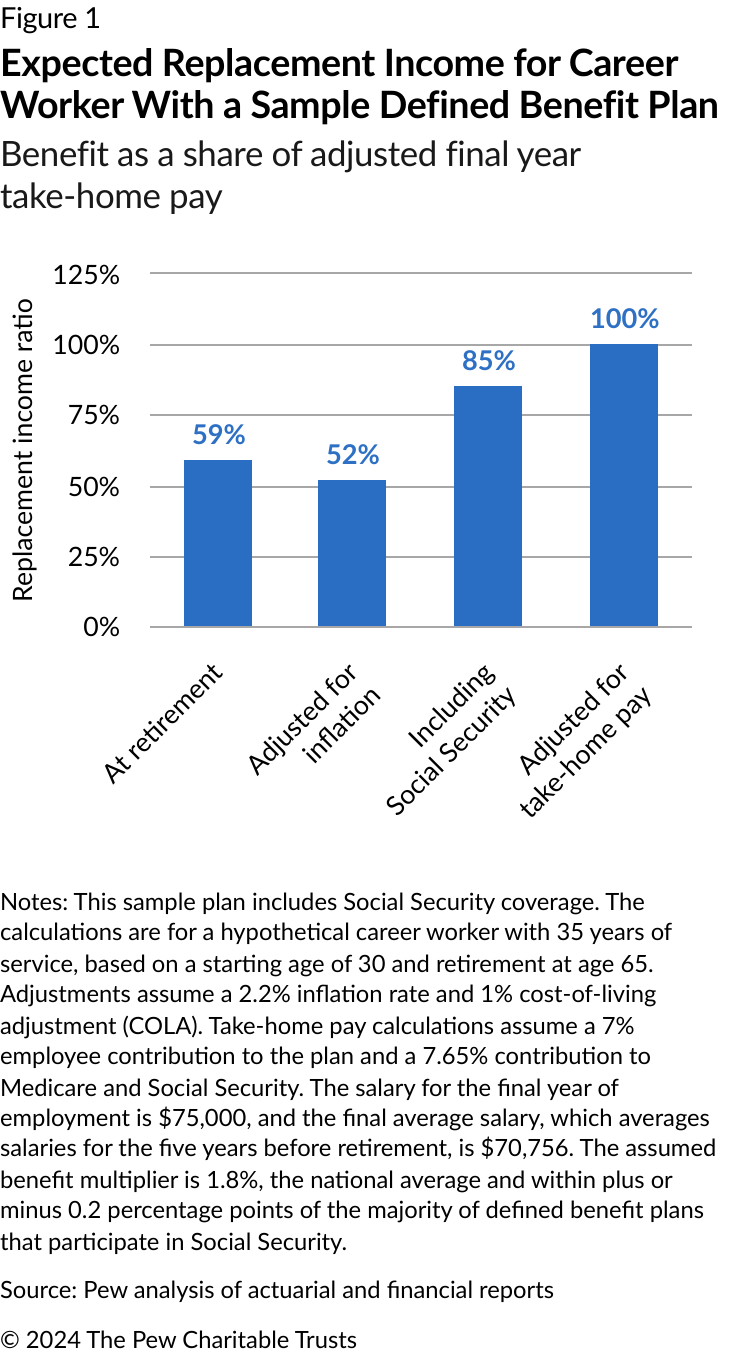
Replacement income ratio
The replacement income ratio indicates that most states provide robust retirement benefits to their career workers. Among the plans that Pew analyzed, 63 participate in Social Security—meaning plan participants contribute to and are eligible for Social Security. And in all but 14 of those plans, workers who spend 35 years with an employer can replace at least 90% of their take-home pay in retirement, and most of the others allow workers to replace at least 80%. Among the 18 systems that do not participate in Social Security, 13 fall below an 80% ratio.6
To calculate the replacement income ratio, Pew uses a multistep process that adjusts for the impact of inflation during retirement and includes expected Social Security benefits if applicable. The final ratio compares the retirement benefit with a member’s final take-home pay less employee contributions to Social Security, Medicare, and the state retirement system. (See Figure 1.)
Although the replacement income ratio provides important insight about career workers’ ability to maintain their standard of living in retirement, it does not capture how well plans support workers who change jobs before retirement. In particular, it doesn’t measure whether and to what extent retirement plans allow departing workers to take their accrued benefits with them.


Retirement savings rate
To assess the retirement security of these shorter-term and mid-career workers, Pew uses the savings rate metric, which includes all departing employees, whether vested in the retirement plan—that is, having worked long enough to receive full benefits—or not.
For systems with Social Security coverage, Pew has determined, based on expert recommendations and average rates in the private sector, that a savings rate of 10% of workers’ annual salary at the time they leave their employment is the minimum necessary to put workers on a path toward retirement security.7
Most systems provide separating employees with an inadequate level of retirement savings. Only 16 offer a saving rate of at least 10%, and of those, just seven—in Arizona, Georgia, Montana, Nebraska, Tennessee, South Dakota, and Wisconsin—provide 12% or more. The average savings rate is about 8%, and only 21 systems allow separating employees to take all or some of the retirement contributions their employer made on their behalf.
For systems without Social Security coverage, workers need a higher rate of savings, at least 18%. Of the 18 plans without Social Security coverage, only two meet this minimum standard.
Retirement Readiness
Plans and employers can help workers become more “retirement ready”—that is, prepared to meet their financial needs in retirement—by ensuring that employees have access not only to sufficient retirement benefits but also to education and planning tools. Pew has identified four components that public retirement systems and employers can use to help workers build their retirement readiness:8
- Plan design. Retirement plans structured to ensure that provided benefits meet replacement rate and savings rate goals.
- Supplemental retirement plans. Savings plans, separate from workers’ primary retirement plans, that enable them to set additional money aside for retirement.
- Online participant tools. Web-based resources, such as personalized retirement income calculators, educational webinars, and information, that help workers make informed decisions.
- Financial advice. Access to one-on-one retirement or investment advice from trained financial professionals.
Fund pension obligations sustainably, predictably, and affordably
Fiscal sustainability for public pension plans means that government revenue matches expenditures over time without a corresponding increase in debt. And efforts to achieve fiscal sustainability should also account for the goal of eventually reducing pension debt and for the long-term effects of investment risk and market volatility on plan balance sheets and government budgets.
Metrics
With those objectives in mind, Pew assesses whether pension systems meet fund sustainability by evaluating plans’ risk of insolvency, sufficiency of current contribution levels to reduce pension debt, and predictability of costs given various fiscal conditions, including whether investment returns fall short of expectations or whether other demographic or economic problems arise.
For these metrics, Pew collected data for more than 230 pension plans and calculated results at the plan and state levels.
Solvency
Pew tests for insolvency risk using the operating cash flow (OCF) ratio metric, calculated as the amount by which benefit payments exceed contributions as a percentage of plan assets. The OCF ratio examines whether cash inflows from contributions plus investment returns will be sufficient to fund benefit payments without depleting plan assets or requiring additional expenditures from states’ annual budgets. Pew assumes a scenario in which average returns fall at or below 5% over a 20-year period. Based on this conservative, low-return scenario, an OCF ratio below -5% provides an effective early warning sign of insolvency risk. In other words, pension plans with returns of less than 5% and an OCF ratio of –5% would experience declining assets unless they significantly increased contributions.
When Pew began calculating and using the OCF in 2014, six states had cash flow ratios below -5%, including some of the worst-funded states. By 2022, however, all 50 states had ratios above that threshold, thanks mainly to significant increases in employer contributions, which rose an average of 7% annually from 2014 to 2022. Likewise, benefit reforms have helped to curb growth in benefit payments, further boosting cash flow. All 50 states met Pew’s metric for solvency in 2022 based on these improvements.
Debt reduction
Sustainable funding practices also enable plans to maintain or reduce the size of pension debt over time. Almost all state pension systems have an explicit long-term goal of achieving full funding of promised benefits, and they use that target to estimate benefit costs. Consistent failure to make progress toward that target indicates that a state’s policies are insufficient to deliver fiscal sustainability. Although most states have not funded public pensions sustainably during the past 20 years, many have made significant improvements in recent years.
Pew’s primary tool for assessing the adequacy of a state’s pension contributions to reduce pension debt is the net amortization benchmark, calculated as the total amount of money needed to pay for new benefits earned by current employees in a given year and to cover interest on the plan’s existing pension debt at the start of the same year. States where contributions exceed this benchmark have positive amortization and can expect pension debt to decline year over year so long as investments meet expectations and other assumptions hold true. States that fall short of this benchmark have negative amortization and can expect funding gaps to grow over time. When a state’s contributions hover around the benchmark, Pew considers that state’s net amortization stable and expects its pension debt to hold roughly steady over time.
States collectively had a net amortization of more than 8% of payroll in 2022 and so, in the aggregate, would have decreasing pension debt. Forty-seven states had positive net amortization (at least 0.5% of payroll), and only two—Illinois and New Mexico—had negative net amortization (below -0.5% of payroll). The remaining state, Mississippi, was stable.
Tracking net amortization illustrates how measures of fiscal sustainability illuminate improvements and challenges. A strong commitment to fiscal discipline across several states has significantly improved the outlook for overall state pension funding, while at the same time, the track record of states that continue to make inadequate contributions highlights the need for ongoing monitoring of how states manage their pension debt.
Predictable costs
Fiscally sustainable pension plans maintain benefits that are sufficient to enable states and localities to recruit and retain a high-quality public workforce without compromising other state budget priorities. This is particularly important during periods of economic uncertainty, when contribution volatility can strain government budgets.
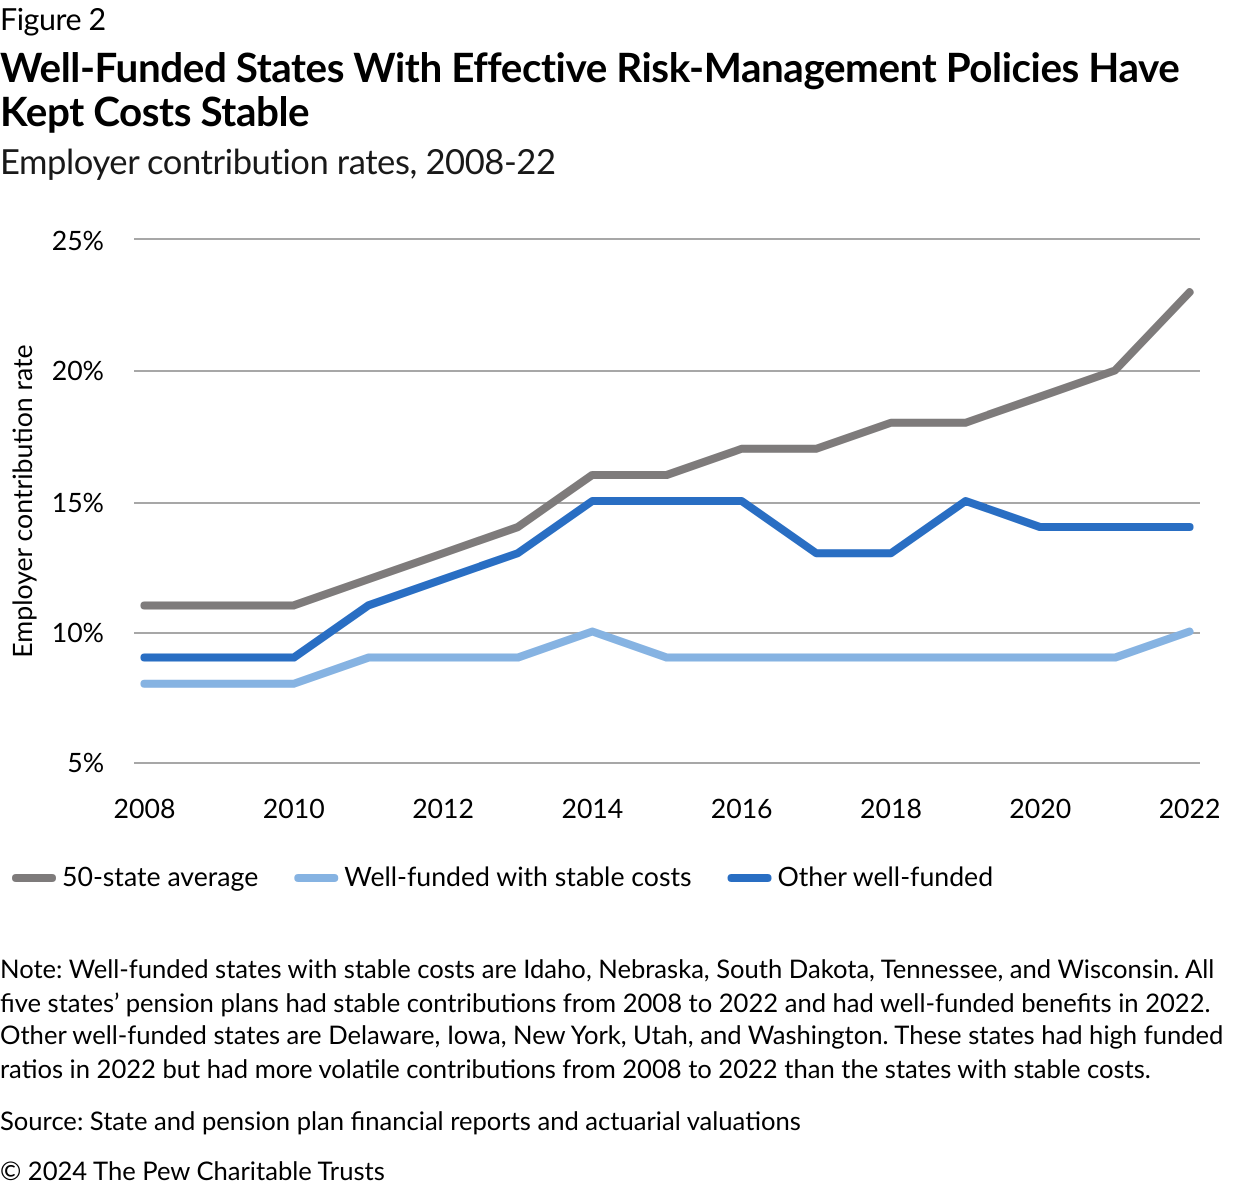
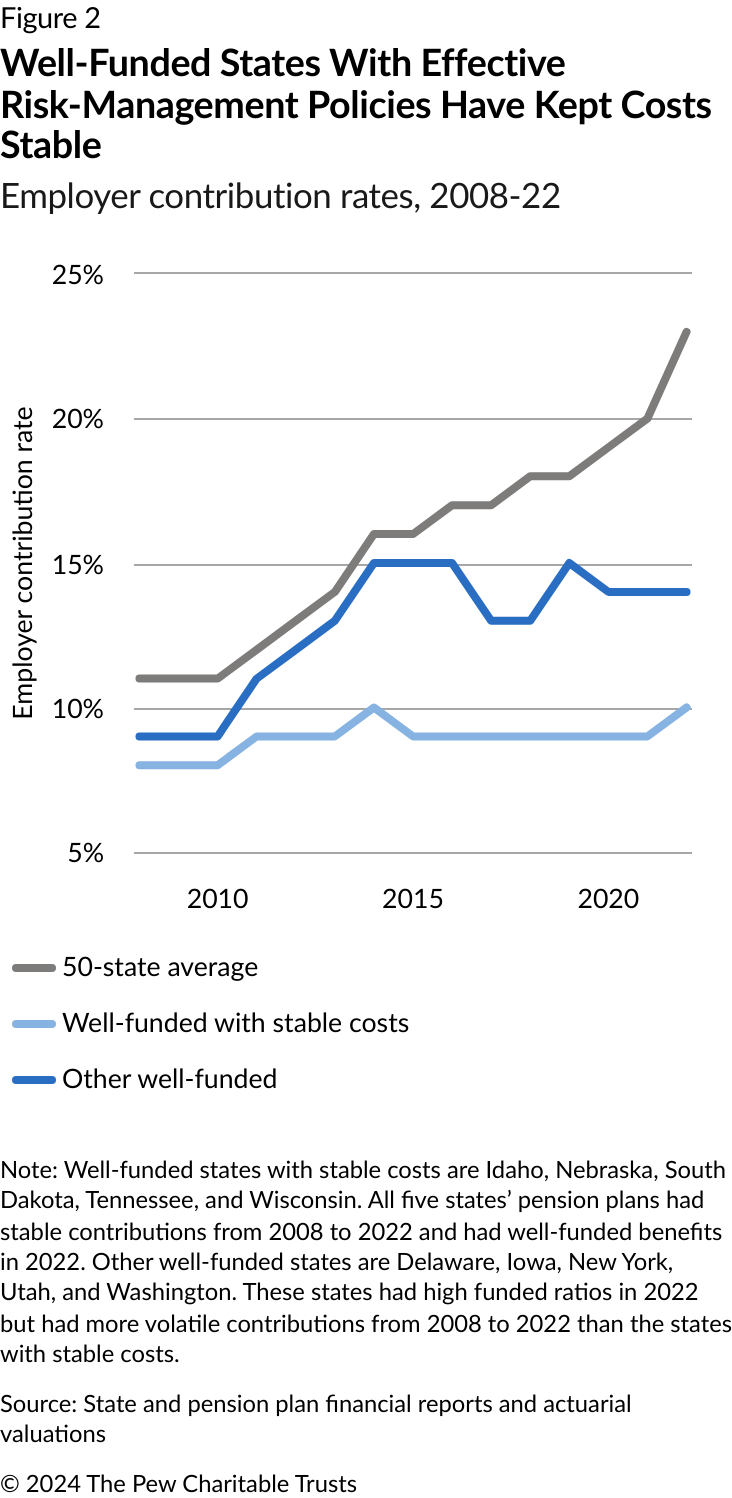
To measure fiscal sustainability, Pew tracks historical contribution volatility—the range between the highest and lowest contribution rates over a specific time frame. From 2008 to 2022, well-funded states, such as Idaho, Nebraska, South Dakota, Tennessee, and Wisconsin, maintained stable costs within a range of plus or minus 3% of payroll while preserving adequate benefit funding or reducing debt. They did so primarily by following funding and risk-sharing policies that reduce the sensitivity of existing and future benefit costs to economic shocks and the business cycle.
In contrast, the average state saw contribution rates nearly double from 2008 to 2022. The states with the lowest funded ratios, which had also been underfunding their pension plans most severely before the 2007-09 recession, saw the biggest contribution rate increases. But even well-funded states that did not have policies to ensure stable contribution rates saw significant jumps during that period. (See Figure 2.)


When costs are unpredictable or rise rapidly as a share of public budgets, they crowd out other important state spending priorities. For instance, employer pension contributions rose twice as fast as state revenue after the 2007-09 recession in order to make up for past pension contribution shortfalls, and as a result, states had to forgo or defer more than $300 billion in other public priorities.9
Plan for economic and demographic uncertainty
Pew assesses whether states have a plan for managing the unknowns of future economic and demographic conditions by evaluating two factors. The first is whether the system has adopted risk reporting using forward-looking assessments such as stress tests that measure funding levels and required annual contributions under a range of economic scenarios. Comprehensive risk reporting helps states estimate the impact of market corrections on pension plan balance sheets and employer costs, which in turn helps them manage the risk that future investment returns will fall short of assumptions.
The second is whether the system has incorporated risk mitigation and sharing features into its plan design. Risk-sharing practices help state retirement systems manage uncertainty by reducing their exposure to investment, demographic, and longevity risks, and distributing unexpected costs among the plan stakeholders—employers, employees, and retirees—according to predefined rules.
Metrics
Risk reporting
Pew’s minimum standard for pension risk reporting includes the use of forward-looking quantitative analyses of investment risk—that is, the likelihood that investment returns will deviate from assumptions—in plan financial and actuarial reporting. (See Table 2.) These analyses should be sufficiently detailed to measure the effects of investment risk on required contributions and funding levels. In addition, assessments should provide policy-relevant information to governmental plan sponsors and budgetary decision-makers. Although no one-size-fits-all approach is necessarily appropriate to assess investment risk in every state, Pew has identified three elements common to effective risk reporting policies.
Table 2
3 Elements Define Effective Risk Reporting Policies
Key practices
| Routine and transparent | Forward-looking | Policy-relevant | |
|---|---|---|---|
| An effective risk reporting policy … | Requires regular stress testing with results made publicly available. | Assesses the effects of low or volatile investment returns on plan funding levels and contributions. | Analyzes budgetary implications of potential plan costs. |
| Reports ... | Are targeted to plan fiduciaries and governmental sponsors among other stakeholders. | Provide a framework for tailoring analyses to reflect plan circumstances and relevant economic scenarios. | Include information vital to long-term decision-making. |
Assessments may range from simplified projections included in actuarial valuations to more detailed, stand-alone stress tests.
To identify risk reporting practices across the 50 states and ensure that those assessments are transparent and readily available, Pew reviewed public disclosures and other financial and actuarial reports, board materials, and additional documents for 100 state pension plans published on plans’ or states’ websites. To date, Pew has found that 25 states (see Figure 3) conduct some kind of routine, forward-looking assessment of investment risk and potential budget impacts—whether legislatively mandated or simply a standard operating procedure—that allow policymakers, plan administrators, and budget officials to understand what investment volatility or low returns might mean for plan funding and for state and local government costs:
- 12 have implemented statutory stress testing requirements.
- 8 require regular risk assessments as part of a formal policy established by a board of trustees or legislative oversight body.
- 5 have incorporated forward-looking assessments into their annual actuarial valuations.
This information in turn allows for assessment of whether adequate strategies are in place to manage an uncertain future or whether changes might be needed to benefit design, contribution policy, investment choices, or budget planning to ensure that a drop in financial markets will not threaten long-term plan solvency or unaffordably increase pension costs.

Risk sharing
Most defined benefit plans—which provide lifetime retirement income using a formula based on an employee’s final average salary, years of service, and retirement age—place most or all of the risk associated with providing the retirement benefit on the employer. This means that employers are primarily responsible for navigating the plan through economic or demographic uncertainty.
To evaluate the level of risk that the plan sponsor carries, Pew uses a metric called normal cost sensitivity, which measures the expected volatility of employer costs for future benefits if investments returns are lower than expected.10 Pew applies this metric to the major pension plans in each state and then classifies them according to the results.11 (See Figure 4.)
The states with low employer cost volatility all have risk-sharing features within their plan designs. States with medium volatility may have cost-sharing features that cover just one of several retirement systems in the state, have plan provisions that distribute only a portion of the unexpected cost, or use a low discount rate when calculating liabilities that limits the negative consequences when investment returns fall short. States with high levels of volatility continue to place most or all of the risk associated with economic downturns on employers.

Risk-sharing practices may be baked into the plan design, such as when hybrid plans pair a smaller defined benefit component with an individual savings account, or they may be features added to a traditional pension. These may include a variable COLA or annual contributions that are split between employers and employees.
Variable COLAs, which adjust in response to investment returns, ideally smoothed over a set number of years, stand out as a tool that provides significant risk reduction and is highly effective at reducing risk while balancing the retirement security needs of retirees. In general, this approach could include a COLA that is calculated annually to match the consumer price index with a set maximum adjustment amount. Under this approach, when average investment returns over a five- or 10-year period fall below expectations, the maximum COLA amount adjusts downward within a set range.
Ensure that investment policies are fully transparent
Over the past several decades, the investment landscape for pension funds has shifted toward riskier investments, with approximately three-quarters of pension assets invested in high-risk categories, including stocks and “alternative” investments such as private equity, real estate, and hedge funds, as of 2019.12 Although these investments can deliver significant returns, they also bring elevated risks and substantial management fees. In light of these factors, policymakers, beneficiaries, and other plan stakeholders have an increased need for access to transparent and comprehensive information on investment performance and costs.
Metrics
Pew evaluates investment transparency using two metrics:
- Do plans make investment policy statements comprehensive, transparent, and readily accessible to stakeholders?
- Do bottom-line performance disclosures reflect the return on investments after subtracting fees paid to investment managers?
Pew applies these metrics to the nation’s 73 largest pension funds, which includes at least one plan in each state.
Transparency in investment policy statements
Transparency begins with comprehensive investment policy statements that clearly define objectives, risk parameters, and asset allocation strategies. Sharing these policies online is essential to ensure that trustees, policymakers, and workers have access to the information they need to assess plan performance. Pew’s most recent analysis finds improvement, with 65 of the 73 plans scrutinized making their investment policies publicly accessible online as of 2022, a slight increase from 59 in 2016.
Disclosure of performance gross vs. net of fees
Accurately assessing investment returns requires accounting for the costs of managing plan assets. Pew recommends that plans fully disclose their returns net of fees, factoring in the costs paid to investment managers. Recent trends show progress, with a decreasing number of pension funds reporting performance gross of fees, although a substantial number still lag in providing this vital information. (See Figure 5.)

Conclusion
This model retirement framework provides a comprehensive view of how states are progressing in meeting key objectives related to retirement security, fiscal sustainability, risk mitigation, and investment transparency. Additionally, the framework offers states a structured approach for evaluating and enhancing their retirement plans that draws on valuable insights and exemplary characteristics of systems that have successfully ensured retirement security for their workforce while maintaining long-term fiscal stability.
Endnotes
- The Pew Charitable Trusts, “Preparing for Retirement,” 2015, https://www.pewtrusts.org/-/media/assets/2015/10/statelocalemployeesurvey-report.pdf.
- The Pew Charitable Trusts, “Preparing for Retirement.”
- David Knapp, Beth J. Asch, and Michael G. Mattock, “Public Employee Retention Responses to Alternative Retirement Plan Design,” Rand, 2021, https://www.rand.org/pubs/working_papers/WRA816-1.html; Beth J. Asch, David Knapp, and Michael G. Mattock, “The Effects of Public Sector Retirement Plan Reform on Workforce Retention,” Rand, 2023, https://www.rand.org/pubs/working_papers/WRA816-2.html; Aleena Oberthur and Mollie Mills, “How State Pension Reforms Can Affect Employee Retention,” The Pew Charitable Trusts, 2023, https://www.pewtrusts.org/en/research-and-analysis/articles/2023/06/01/how-state-pension-reforms-can-affect-employee-retention.
- The Pew Charitable Trusts, “How Measuring Replacement Income Can Aid Assessment of Public Pension Plans,” 2020, https://www.pewtrusts.org/-/media/assets/2021/01/how_measuring_replacement_income.pdf.
- Aleena Oberthur and Mollie Mills, “Retirements at Risk: Many States Fall Short in Helping Mid-Career Workers Save,” The Pew Charitable Trusts, 2023, https://www.pewtrusts.org/en/research-and-analysis/articles/2023/07/31/retirements-at-risk-many-states-fall-short-in-helping-mid-career-workers-save.
- This calculation does not include any supplemental plan savings that individuals may have. Supplemental retirement plans, such as a 457 plan, are typically voluntary plans that employees can contribute to to secure additional retirement income on top of their primary plan. Participation levels differ among systems and are frequently quite low.
- The 10% benchmark is based on the average rate observed in the private sector, where workers who have access to an employer-sponsored retirement plan typically save about 10% to 11% of their salaries annually. The 12% benchmark is based on expert recommendations, including one of the most widely cited studies on the topic, from the RETIRE Project at Georgia State University, which estimated that plans should target a replacement rate of more than 70% for most workers. See Bruce Palmer, “2008 GSU/Aon Retire Project Report,” Georgia State University, 2008, https://web.archive.org/web/20140123135351/http://rmictr.gsu.edu/Papers/RR08-1.pdf. Subsequent research calculated a savings rate of at least 12% needed to meet the goal of putting workers on a path to retirement security, and other studies provide similar recommendations. See Vanguard, “How America Saves,” 2023, https://institutional.vanguard.com/content/dam/inst/iig-transformation/has/2023/pdf/has-insights/how-america-saves-report-2023.pdf; Monique Morrissey, “The State of American Retirement Savings,” Economic Policy Institute, 2019, https://files.epi.org/pdf/136219.pdf; Roderick B. Crane, Michael Heller, and Paul J. Yakoboski, “Defined Contribution Pension Plans in the Public Sector: A Benchmark Analysis,” in The Future of Public Employee Retirement Systems, ed. Olivia S. Mitchell (Oxford, 2009), https://doi.org/10.1093/acprof:oso/9780199573349.003.0013; Jennifer Erin Brown, “Millennials and Retirement: Already Falling Short,” National Institute on Retirement Security, 2018, https://www.nirsonline.org/wp-content/uploads/2018/02/Millennials-Report-1.pdf.
- The Pew Charitable Trusts, “Four Plan Features Can Boost ‘Retirement Readiness,’” 2024, https://www.pewtrusts.org/en/research-and-analysis/fact-sheets/2024/04/four-plan-features-can-boost-retirement-readiness.
- The Pew Charitable Trusts, “State Pension Contributions Hit Important Benchmark,” 2022, https://www.pewtrusts.org/en/research-and-analysis/issue-briefs/2022/10/state-pension-contributions-hit-important-benchmark.
- Pew sets the low return scenario at 5%.
- Because many states have adopted changes to benefit provisions for new hires that reduce overall costs, using the latest tier of benefits when calculating normal cost sensitivity will often result in lower levels of cost and volatility compared with using the benefits received by most current employees and retirees. Examining the cost of new benefits allows a financial or budget analyst to focus on the area where policymakers have the greatest ability to make changes needed to keep costs stable and sustainable.
- The Pew Charitable Trusts, “State Public Pension Fund Returns Expected to Decline,” 2022, https://www.pewtrusts.org/en/research-and-analysis/issue-briefs/2022/05/state-public-pension-fund-returns-expected-to-decline; The Pew Charitable Trusts, “Transparency in Investment Disclosures Helps Promote Effective Public Pension Administration,” 2023, https://www.pewtrusts.org/en/research-andanalysis/issue-briefs/2023/10/transparency-in-investment-disclosures-helps-promote-effective-public-pension-administration.


ADDITIONAL RESOURCES


