Investors Buy One-Third of All Single-Family Homes in Philadelphia
City data shows they tend to purchase properties for less money than traditional buyers do, and in different neighborhoods

Of the 19,000 single-family home purchases made in Philadelphia in a typical year, investors account for about a third of them, according to an analysis of city records by The Pew Charitable Trusts. Moreover, investors tend to buy in different neighborhoods from those chosen by traditional buyers purchasing homes for themselves using a mortgage.
Overall, there are three categories of purchasers involved in single-family sales in which buyers and sellers act independently in their own interests, known as arm’s-length sales: traditional homebuyers using mortgage financing to secure their personal dwelling; investors; and cash buyers who may be buying a home as a place to live or as an investment property.
From 2000 through 2021, traditional homebuyers accounted for 53% of home sales in the city, while investors accounted for 32% and cash purchasers 16%. Cash purchasers no doubt include some investors, but it is hard to determine how many from available data. A new Pew report, “Single-Family Home Sales in Philadelphia,” explores how homebuying has changed since 2000, with a focus on purchases by traditional homebuyers. This analysis, on the other hand, looks more closely at the role of investors and cash buyers in the marketplace.
Importantly, the data shows that investors and cash buyers in Philadelphia’s housing market tend to operate in different parts of the city—and often at different price points—from traditional homebuyers.
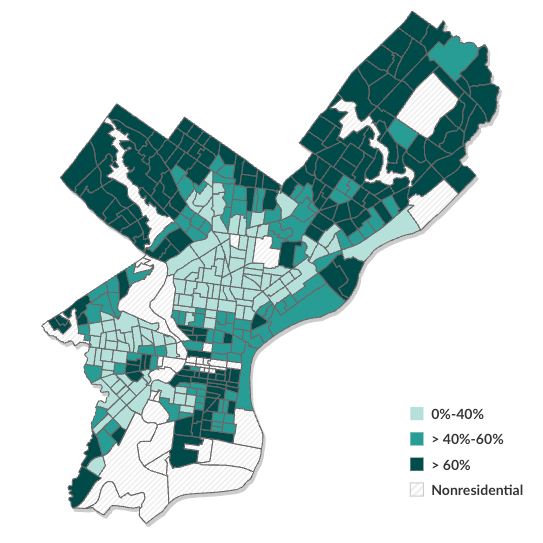
That can be seen in Figure 1, which consists of two maps. The first shows home purchases by traditional buyers from 2000 through 2021. The darkest shade depicts areas where traditional sales accounted for more than 60% of all arm’s-length transactions. These areas—Northeast, Northwest, and South Philadelphia as well as much of Center City and the surrounding neighborhoods—were also the strongest housing markets in the city over this period.
The second map depicts investor and cash purchases, which accounted for more than half of arm’s-length transactions in much of North, West, and Southwest Philadelphia. Traditional homebuying activity has been lower in these communities, which also typically have high levels of property vacancy and disinvestment. Many of the homes in neighborhoods where investors have been the most active tend to require significant repairs and for the most part represent a different inventory from the properties that appeal to and are eligible to be financed by traditional homebuyers using mortgages (see Figure 1).

Single-Family Home Sales in Philadelphia, 2000-21
Percentage sold to traditional buyers
Percentage sold to investors and cash buyers
Two shaded maps of Philadelphia show the percentage of homes in each census tract that were sold to traditional buyers (left) or to investors and cash buyers (right). The maps show that tracts with the highest percentages of traditional homebuyers have the smallest percentages of investor buyers (left). Those with the highest percentages of investor buyers have the lowest percentage of traditional homebuyers (right). In both maps, the darkest shade of green depicts tracts where more than 60% of all homes were sold to either traditional homebuyers (in the left map) or investors and cash buyers (in the right map); the middle shade shows tracts where 41-60% of all sales were sold to one type of buyer; and the lightest shade depicts areas where 40% or less of all sales were sold to one type of buyer. Traditional homebuyer purchases are concentrated in Northeast, Northwest, and parts of South Philadelphia, shown in the map at left. Investor purchases are concentrated in North, West, and Southwest Philadelphia, shown in the map at right.
Percentage sold to investors and cash buyers
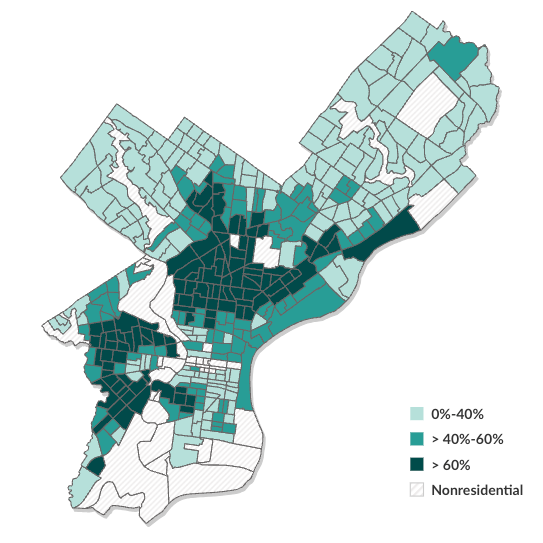
Notes: The figures show the percentages of homes sold to two categories of buyers in arm's-length transactions, defined as those in which buyers and sellers act independently in their own interest. Traditional homebuyers use mortgage financing to secure their personal dwellings. The second category includes investors as well as cash buyers.
Source: The Pew Charitable Trusts’ analysis of Philadelphia Department of Records, real estate transfer data
© 2024 The Pew Charitable Trusts View image View image
Of course, the homebuyer and investor markets overlap. Of all residential census tracts in the city, there are none where investors are absent, nor are there any where no traditional homebuyers have purchased homes using a mortgage.
Throughout the period studied, investors and cash buyers paid markedly less than traditional homebuyers for their purchases—in 2021, they paid a median of $100,000 compared with $265,000 for the traditional buyers. Some of this price difference is explained by the fact that investors are more active in the parts of the city that have low-cost housing inventory. But even when investors and traditional purchasers buy homes in the same neighborhood, investors typically pay significantly less. In 2021, 22% of homes in Philadelphia were purchased for $100,000 or less; more than 9-in-10 (93%) of those homes were bought by investors or cash buyers.
Direct competition with investors, when it occurs, places traditional homebuyers at a disadvantage. Sales to traditional buyers can be lengthy particularly if those buyers are using financial tools designed to facilitate homeownership, such as down payment assistance or loans backed by the Federal Housing Administration. Renovation mortgage programs, which combine the cost of property repairs and the property’s mortgage into one loan, can also add weeks and additional complexity to the homebuying process.
Selling to investors is typically more straightforward. This class of buyers is often looking to make a quick sale without contingencies for inspections, appraisals, or financing approval. Working with investors also often eliminates the burden on home sellers to repair or upgrade their properties before placing them on the market or finalizing a sale, an important selling factor for the thousands of Philadelphia households that struggle to keep up with regular home maintenance and major repairs.
Roughly 40% of all homes sold by individual home sellers from 2000 through 2021 were sold to investors or cash buyers. And in investor-rich parts of North and West Philadelphia, 72% of homeowners sold their properties to these types of buyers.
In fact, from 2000 through 2021, investors and cash buyers were more likely to have purchased their properties from individual homeowners than from other investors or from a financial or government entity. Of the 214,000 single-family homes purchased by this group in arm’s-length transactions over this period, 61% had been previously owned by individual homeowners or their heirs. Some investor-owned homes are ultimately returned to owner occupancy. Traditional homebuyers purchased 57,000 homes from investors during the analysis period. Still, far more homes have been transferred to investors from homeowners than the other way around.
Investors often serve Philadelphia’s housing market by securing and upgrading properties with accumulated deferred maintenance and returning those homes to the market for occupancy by new homeowners or renters. Their access to a wide range of financing tools makes them uniquely positioned to do the necessary work of restoring the city’s housing stock. But when this class of buyers lacks the resources or inclination to invest in property maintenance or upgrades, they can also be a source of neighborhood decline or stagnation.
At least one in three homes in Philadelphia, and 9 out of 10 among its lowest-cost properties, are sold to investors. That means investors have the power to shift the market value, structural integrity, and aesthetic appeal of the city’s neighborhoods.
Octavia Howell works on The Pew Charitable Trusts’ Philadelphia research and policy initiative.


