‘Lost Decade’ Casts a Post-Recession Shadow on State Finances
Despite almost 10 years of national economic recovery, strains from the 2007-09 downturn still linger in many states

Overview
Nearly 10 years after the end of the Great Recession, state governments have put the worst behind them. But the deepest downturn since World War II also has lived up to early predictions that states would face a “Lost Decade” because of missed economic and revenue growth.1
The legacy of the lost decade is easily overlooked given the second-longest U.S. economic expansion on record, arguably the longest bull market for stocks in U.S. history, unemployment at near-historic lows, and a recent spurt in the growth of state tax revenue. Although the 18-month recession, which ended in June 2009, may seem long ago, a closer look reveals that many states are still coping with lingering—maybe even lasting—effects on their finances.
Like a family that suffered a job loss or pay cut during the recession, states missed out on billions of dollars in tax revenue. Even if a family’s earnings are now back to par, the household faces consequences from those years when it was unable to save for college, add to retirement accounts, or fix the roof.
Likewise, even though total state tax revenue recovered nearly six years ago from its losses in the downturn, many states are still dealing with fallout from the tough choices they had to make to fill budget holes during the recession, including recent strikes by teachers who went years without pay raises, higher tuition at public universities, complaints from local governments living with less state aid, mounting repair bills for public infrastructure, and smaller state workforces. State policymakers also feel pressure to replenish rainy day funds for the next inevitable downturn, even though their budgets are squeezed by higher health care costs and unfunded pension liabilities.
To be sure, most states’ annual finances were better off heading into 2019 legislative sessions than they had been in 10 years. As The Pew Charitable Trusts’ Fiscal 50 tool shows, states’ combined inflation-adjusted tax revenue was more than 13 percent higher than at its 2008 peak, just before receipts plunged and the lost decade began. States’ rainy day funds collectively held more money than in any year on record. And many governors in 2019 proposed spending increases to help fill some of the holes gouged by the recession, including about 20 seeking pay raises for teachers and at least 17 requesting extra dollars for higher education to curb the need for tuition hikes.2
Fiscal 50: State Trends and Analysis
But the recent surge in tax revenue already has begun to sputter, raising uncertainty over how much of the gains were temporary in reaction to 2017’s federal tax overhaul rather than a trend. Meanwhile, states face a backlog of spending demands that have piled up over the past decade.
Here are 10 ways that states face a legacy from the lost decade.3 These examples show that states, collectively or in significant numbers, still haven’t completely shaken off the effects of the downturn.

The recession undercut states’ largest source of revenue: tax dollars. States missed out on an estimated $283 billion when collections fell and remained below 2008’s level until 2013 after adjusting for inflation.4 That figure likely underestimates the amount of forgone revenue because it does not reflect potential growth in tax receipts under normal economic circumstances. Temporary federal stimulus aid from the American Recovery and Reinvestment Act—including $147 billion in Medicaid and education funds—helped offset some of the shortfall.5 Still, states were left with less to invest in higher education, public employee pensions, infrastructure, and other needs.
Even though total state tax collections in late 2018 were 13.4 percent higher than a decade ago, based on quarterly tax revenue collections adjusted for inflation, nine states still were taking in fewer tax dollars than at their peak before receipts fell in the 2007-09 downturn.6 The bottom line is that not all states have regained the purchasing power they had at their peaks and are still playing catch-up in some spending categories.

Nationally, spending from states’ general funds—the largest source of state expenditures—has surpassed pre-recession levels by 4.3 percent after adjusting for inflation, but states’ recoveries have varied widely.7 In fiscal year 2018, 23 states still spent less in inflation-adjusted terms than in fiscal 2008, when they were just starting to get hit by the recession.8 Spending increases approved for fiscal 2019, which ends June 30 for most states, would still leave an estimated 17 states with lower expenditures than before the recession in real dollars.9
As states’ economies slowed, dwindling tax revenue triggered budget shortfalls. To balance their books, states relied on a mix of tax increases, budget cuts, and savings. But cuts in some state programs haven’t been restored. Even in the 27 states where spending in inflation-adjusted dollars had surpassed fiscal 2008 totals by fiscal 2018, not all programs were back to previous levels.
Spending in nine states in fiscal 2018 was more than 10 percent below fiscal 2008 levels. Nowhere was spending down more than in Alaska—by nearly a third compared with a decade ago. Still, 14 states were spending at least 10 percent more than at the start of the recession, led by North Dakota’s 53 percent jump since fiscal 2008.

State financial support for higher education—the third-biggest slice of state budgets—was still 13 percent below its high before the downturn on a per-student basis after adjusting for inflation. Cuts were widespread, with 40 states in fiscal 2018 reporting lower per-student funding, which includes appropriations to public colleges and universities, financial aid to students and their families, and research grants to institutions.10
Faced with diminished tax revenue and the need to balance budgets, many states reduced their higher education spending in the wake of the recession. Many states now rely primarily on tuition revenue from students and their families, rather than state support, to fund public higher education. Nationally, tuition dollars collected by public universities jumped 43 percent per student from 2008 to 2018 after adjusting for inflation.11
State financial support peaked at $9,248 per full-time-equivalent student in fiscal 2008 and fell by about a quarter to its lowest level of $6,888 in fiscal 2012.12 State support has partially recovered but still remained 13 percent below fiscal 2008 levels in 2018, at $8,073 per student.13 In total dollar terms, this meant states spent $88.2 billion in 2018, 7 percent less than in 2008 after adjusting for inflation.14 Preliminary data show that total nominal state support for higher education increased in 2019 for the seventh year in a row, though support is expected to remain highly sensitive to economic slowdowns.15

Seven years after the recession ended, state funding per pupil for public elementary and secondary schools—the largest area of states’ general fund budgets—stood at $6,745 nationally, below 2008 levels by about 1.7 percent, or nearly $120 per pupil, after adjusting for inflation.16 State support per pupil was lower in a majority of states—29—in academic year 2016 compared with 2008, according to the most recent available data, and was down at least 10 percent in nine of those states. Initial data for 2017 and 2018 show that more than 20 states continued to provide less per-pupil funding than at the start of the recession.17
Primary and secondary schools receive roughly 45 percent of their funding from the state, with a nearly equal share from local governments.18 The mix varies widely, so both funding streams are important in gauging the recession’s full effect on education. After the downturn, both state and local funding fell on a per-pupil basis when faced with declining tax revenue. Although the 50-state total for this combined funding has surpassed 2008 levels, schools in 20 states still received fewer dollars per pupil from state and local funds in 2016.
Wrapped up in school funding are teacher salaries, which on average were still below pre-recession levels in 2016 in real dollars.19 But how much teachers earn and who funds their salaries differ significantly by state. Even an increase in per-pupil spending doesn’t necessarily mean more dollars for salaries and classrooms. For example, an increase also could reflect rising pension contributions.

In the wake of the recession, state governments reduced investing in infrastructure. As a share of the economy, state spending on fixed assets—such as highways, sidewalks, airfields, electronics, or software—has been falling since 2009.20
In real dollars, state governments’ investments in infrastructure dropped by 3.2 percent from 2007 to 2017, with ups and downs along the way. But infrastructure spending relative to gross domestic product (GDP) dropped almost every year between a 2009 peak and 2017, following more than two decades of stability. In fact, 2017 marked the lowest level of funding as a share of the economy in more than half a century. States’ declining infrastructure investment relative to GDP is a sign that spending on fixed assets has not kept pace with economic growth.
Because state-level data on infrastructure investment by category are unavailable, a look into combined investments by states and localities shows that infrastructure types were affected differently.21 For example, transportation structures—such as air transportation and mass transit systems—seem to have been prioritized, with a nearly 30 percent increase in spending. Funding for highways and streets, which generally receive the most state and local infrastructure investment, dropped 6 percent between 2007 and 2017, while spending on the second-largest recipient—educational structures such as schools—fell 14 percent after accounting for inflation.

In the recession’s wake, many local governments had to manage with less money from their states. Total state aid to localities was down by 5.3 percent at its post-recession low point in fiscal 2013 and was still slightly lower—by just 0.8 percent—at the end of fiscal 2016 than before the recession after adjusting for inflation. But local governments in 26 states received less state aid in fiscal 2016 than in fiscal 2008, the last year before tumbling tax revenue led to budget cuts and forced states to cut spending. The decline in state aid to local governments ranged from less than 0.5 percent in Pennsylvania to 22.8 percent in Arizona compared with fiscal 2008.
Cutbacks in state aid put a strain on local budgets and exposed cities and other localities to greater risk of financial problems. For local governments together, state aid is the second-largest source of revenue after tax dollars, and significant cuts can lead to difficult decisions about raising other revenue or cutting spending.

One way for states to cut spending during downturns is to reduce their payroll. Whether through early retirements, buyouts, or layoffs, state agencies can cut spending by shrinking their workforce. The 2007-09 recession was no different. Total state employment, excluding teachers and other public school staff, peaked at slightly above 2.8 million public employees in 2008 as states had not yet borne the brunt of the recession.22 After shedding almost 170,000 jobs and reaching its lowest point in 2013, the state workforce nationwide started to grow slightly. However, in 2018, more than a decade after the recession began, state governments across the U.S. still had fewer employees, having lost 4.7 percent, or more than 132,000 jobs, from the peak.
With fewer workers on government payrolls, lawmakers’ options for reducing spending in a future recession are reduced.

In addition to pent-up demand to restore spending cuts from the recession, states face the challenge of rebuilding rainy day funds to prepare for the next economic downturn.
At the end of fiscal 2018, these funds held more money than in any year on record. But at least 19 states still had smaller rainy day funds as a share of general fund operating costs than in fiscal 2007—the last full budget year before the recession hit. For many states, though, even pre-recession levels were inadequate to plug huge budget gaps caused by the last recession.
Seven states had less than a week’s worth of operating costs in rainy day funds in fiscal 2018, including Wisconsin (6.8 days), Kentucky (3.0 days), Illinois (0.1 day), and Pennsylvania (less than 0.1 day). Three had nothing: Kansas, Montana, and New Jersey. Although there is no one-size-fits-all rule for how much states should save, the clock is ticking on their chances to use the economic expansion to rebuild reserves.

Medicaid costs borne by the states surged following the recession after the phaseout of a one-time infusion of federal economic recovery dollars. The extra federal aid helped states deal with a spike in enrollment in the health insurance program for low-income Americans after people lost jobs and income during the downturn. Even after the economy improved, Medicaid continued to consume a greater share of state revenue than before the recession.
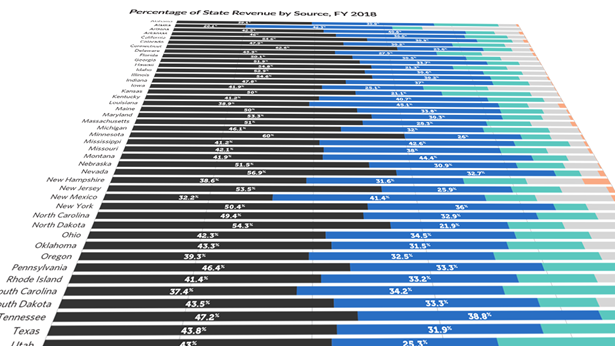
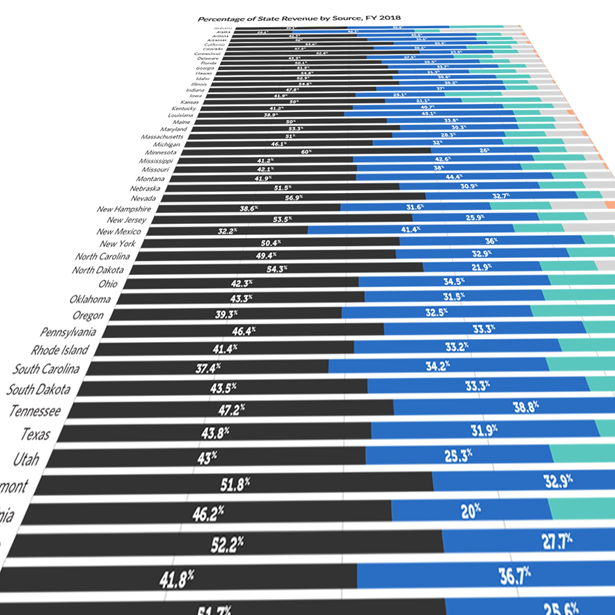
Nationwide, Medicaid expenses accounted for 17.1 cents of every state-generated dollar in 2016, compared with 14.3 cents in 2007, just before the recession.23 Although the federal government covers at least half of the total costs of insuring Medicaid recipients, the portion shouldered by states is their second-biggest expense after K-12 education.24 Higher Medicaid costs can limit what states have left to fund other priorities, such as schools, transportation, and public safety.
Preliminary figures indicate that the dollars states spent on Medicaid also increased in 2017 and 2018, even though a leading cost driver—enrollment growth—began to slow.25 Some of the increase was due to states for the first time picking up a small share of the costs of insuring newly eligible low-income adults under the Affordable Care Act’s optional expansion of Medicaid coverage. Through 2016 (the period shown in Figure 9), the federal government covered 100 percent of the costs of the expansion population. States began picking up 5 percent of the costs for this population in 2017 and will gradually increase their share to 10 percent by 2020.

The recession didn’t cause states’ pension funding problems, but it did compound them—first, by reducing investment returns on the assets that states had saved to fund their employees’ retirements, and second by squeezing state budgets and making it even more difficult to fully fund their annual pension payments.26As a result, the gap grew between how much states had saved and how much they needed to cover the pension benefits promised to public workers. The greater the gap, the more a state would need to set aside annually simply to keep its pension debt from growing.
As of fiscal 2016, states had enough set aside to cover just 66 percent of their total pension liabilities, the lowest level since fiscal 2003 (the earliest available data). The shortfall between pension assets and liabilities amounted to a collective debt of $1.35 trillion by fiscal 2016, taking into account new accounting standards that raised the 50-state total by roughly $100 billion.27
Greater than expected investment returns on the back of a booming stock market in fiscal years 2017 and 2018 helped shrink the 50-state total unfunded pension liability, though estimates show that it remained near historic highs.28 However, market losses in the first half of fiscal 2019 threatened to reverse the progress states may have made in whittling down their pension debt.29
Conclusion
Despite nearly 10 years of national economic growth—in what would be the longest U.S. expansion on record by the end of June 2019—states haven’t fully erased the effects of the recession. Instead of reaching the light at the end of the tunnel as the lost decade ends, some see the tunnel simply getting longer.
Certainly, budget pressures have eased in several ways. But in the aggregate, states still have not fully restored cuts in funding for infrastructure, public schools and universities, the number of state workers, and support for local governments. Even where 50-state results have recovered, many individual states still lag behind: Nearly a fifth of states collect less revenue than before the downturn, more than a third have smaller rainy day funds, and almost half spend less from their general fund budgets than a decade earlier. Meanwhile, fixed costs—for Medicaid and underfunded public pension systems—are higher in almost every state.
One risk is that another recession could hit before states fully recover from the 2007-09 downturn, cementing reduced levels of support for some of those services. Both fiscal and political trends over the past decade suggest that at least some changes in state spending patterns could become permanent.
External reviewers
This project benefited from the insights and expertise of external reviewers Raymond C. Scheppach, professor of public policy, University of Virginia’s Batten School of Leadership and Public Policy, and former executive director of the National Governors Association; and Donald C. Boyd, co-director of the State and Local Government Finance Project at the Rockefeller College, State University of New York at Albany.
Although they reviewed the analysis, neither they nor their organizations necessarily endorse its findings.
Acknowledgments
This chartbook was prepared by Pew staff members Barb Rosewicz, Justin Theal, Joanna Biernacka-Lievestro, Daniel Newman, and Joseph Fleming. The project team thanks its colleagues Henry Watson, Chrissy Steigelman, Bernard Ohanian, Anne Usher, and Liz Visser for research and writing support; Richard Friend and Erin McNally for design assistance; and Thad Vinson and Sarah Leiseca for production and distribution.
Endnotes
- Raymond C. Scheppach, former executive director of the National Governors Association, predicted in 2010 that the recession would have lingering impacts and would result in what he called a “Lost Decade” for states, meaning that “states will not fully recover from this recession until very late in this decade.” National Governors Association, “The State Fiscal Situation: The Lost Decade” (2010), https://classic.nga.org/files/live/sites/NGA/files/pdf/0911FISCALLOSTDECADE.PDF. The term, “Lost Decade,” was often used to describe the period of economic stagnation that afflicted Japan beginning in the early 1990s.
- Brian Sigritz, “Summaries of FY2020 Proposed Executive Budgets,” Budget Blog (blog), National Association of State Budget Officers, April 2, 2019, http://budgetblog.nasbo.org/budgetblogs/blogs/brian-sigritz/2019/04/02/summaries-of-fy2020-proposed-executive-budgets?CommunityKey=eca4d2c7-296d-4ab5-aeab-2024a4e7b0b8&tab=; Kathryn White, “Governors’ Budgets for FY2020: Investing in Education,” Budget Blog (blog), National Association of State Budget Officers, Feb. 19, 2019, http://budgetblog.nasbo.org/budgetblogs/blogs/kathryn-white/2019/02/19/governors-budgets-for-fy2020-investing-in-educatio?CommunityKey=eca4d2c7-296d-4ab5-aeab-2024a4e7b0b8&tab=.
- These measures do not reflect a comprehensive evaluation of the recession’s fiscal effects on states.
- Data reflect total taxes (e.g., sales and income) and include revenue effects of legislative tax changes, so increases or decreases may not be attributable solely to the economy.
- Robert Jay Dilger, “Federal Grants to State and Local Governments: A Historical Perspective on Contemporary Issues,” Congressional Research Service (2018), https://fas.org/sgp/crs/misc/R40638.pdf. Dollar amount is not adjusted for inflation.
- Pew’s analysis is based on data provided under license by the Urban Institute, which includes adjustments and corrections made to the U.S. Census Bureau’s Quarterly Summary of State and Local Government Tax Revenue. Data are adjusted for inflation using the U.S. Bureau of Economic Analysis’ Implicit Price Deflators for Gross Domestic Product.
- Pew analysis of general fund data from the National Association of State Budget Officers, “The Fiscal Survey of States: Fall 2018” (2018), https://higherlogicdownload.s3.amazonaws.com/NASBO/9d2d2db1-c943-4f1b-b750-0fca152d64c2/UploadedImages/Fiscal%20Survey/NASBO_Fall_2018_Fiscal_Survey_of_States_S.pdf. State general fund spending is the predominant source for financing a state’s operations and is largely funded through broad-based state taxes. There are differences in how states design and use their general funds, however. NASBO’s “The Fiscal Survey of States: Fall 2018” reports that aggregate general fund spending in fiscal 2018 was 0.6 percent below its fiscal 2008 level, after adjusting for inflation, while Pew reports that spending was 4.3 percent above pre-recession levels. The discrepancy is due to different methods of adjusting for inflation. NASBO used a state and local government implicit price deflator, and Pew used the implicit price deflators for GDP.
- Pew analysis of general fund data from National Association of State Budget Officers, “The Fiscal Survey of States: December 2009” (2009), https://higherlogicdownload.s3.amazonaws.com/NASBO/9d2d2db1-c943-4f1b-b750-0fca152d64c2/UploadedImages/Fiscal%20Survey/fsfall2009.pdf; and National Association of State Budget Officers, “The Fiscal Survey of States: Fall 2018.”
- Results for fiscal 2019 are preliminary. Pew’s calculations are based on general fund spending totals reported to NASBO soon after fiscal 2019 budgets were enacted, and final totals are likely to be different.
- National Association of State Budget Officers, “State Expenditure Report” (2018), https://www.nasbo.org/reports-data/state-expenditure-report?CLK=a2e3ecf5-8100-4eec-aa7c-d33195f75c01; Pew analysis of data from State Higher Education Executive Officers Association, “SHEF: FY 2018—State Higher Education Finance” (2018), https://sheeo.org/project/state-higher-education-finance. For a detailed look at state higher education funding streams, see The Pew Charitable Trusts, “Federal and State Funding of Higher Education: A Changing Landscape” (2015), https://www.pewtrusts.org/en/research-and-analysis/issue-briefs/2015/06/federal-and-state-funding-of-higher-education.
- Pew analysis of data from the State Higher Education Executive Officers Association, “SHEF: FY 2018.”
- “Full-time equivalent” is a measure used by the State Higher Education Executive Officers Association and U.S. Department of Education, among others, to account for students who are enrolled full time or part time as defined by each institution and to make enrollment numbers comparable across states and institutions.
- Pew analysis of data from the State Higher Education Executive Officers Association, “SHEF: FY 2018.”
- Ibid.
- University of Illinois, “Grapevine Table 1: State Fiscal Support for Higher Education, Fiscal Years 2013-14, 2016-17, 2017-18, and 2018-19,” accessed Feb. 7, 2019, https://education.illinoisstate.edu/downloads/grapevine/tables/GPV_Table1_FY19.pdf.
- Pew analysis of data from National Center for Education Statistics, “Digest of Education Statistics, 2016” (2018), https://nces.ed.gov/pubsearch/pubsinfo.asp?pubid=2017094; National Center for Education Statistics, “Digest of Education Statistics, 2011” (2012), https://nces.ed.gov/pubsearch/pubsinfo.asp?pubid=2012001; National Center for Education Statistics, “Digest of Education Statistics, 2010” (2011), https://nces.ed.gov/pubsearch/pubsinfo.asp?pubid=2011015.
- Pew analysis of data from National Education Association, “Rankings of the States 2017 and Estimates of Schools Statistics 2018” (2018), http://www.nea.org/assets/docs/180413-Rankings_And_Estimates_Report_2018.pdf; and National Education Association, “Rankings & Estimates: Rankings of the States 2008 and Estimates of Schools Statistics 2009” (2008), http://www.nea.org/assets/docs/HE/09rankings.pdf.
- National Center for Education Statistics, “Digest of Education Statistics, 2016.”
- Ibid.
- In this chartbook, state spending on fixed assets reflects state gross government investment data from the U.S. Bureau of Economic Analysis.
- State-level data on infrastructure investment by category are unavailable. The U.S. Bureau of Economic Analysis, the data source used in this survey, provides data on infrastructure investment by category only for states and localities combined.
- Because state jobs in education often have an additional revenue source—tuition—they are excluded from the analysis.
- The Pew Charitable Trusts, “More Than 17 Cents of Each State Revenue Dollar Goes to Medicaid” (2018), https://www.pewtrusts.org/research-and-analysis/articles/2018/06/20/more-than-17-cents-of-each-state-revenue-dollar-goes-to-medicaid. State Medicaid spending includes “clawback” payments states have made since 2006 to partially reimburse the federal government for picking up prescription drug costs for “dual eligibles,” people who qualify for both Medicare and Medicaid.
- Federal contributions range from a statutory minimum of 50 percent to a maximum of 83 percent of the cost of the health services (federal contributions to administrative expenses are less), based on a Federal Medical Assistance Percentage derived from the per capita income of states’ residents as compared to the national average. Additionally, states that choose to extend Medicaid to low-income adults under the Affordable Care Act can shift even more of the costs for newly eligible enrollees to the federal government, which picked up 100 percent of the cost of Medicaid expansion payments through 2016, with this contribution gradually decreasing to 90 percent by 2020. Medicaid and CHIP Payment and Access Commission, “Matching Rates,” https://www.macpac.gov/subtopic/matching-rates; National Association of State Budget Officers, “State Expenditure Report.”
- The Kaiser Family Foundation, “50-State Survey Finds Flat Medicaid Enrollment Tied to a Stronger Economy and New Eligibility Systems,” news release, Oct. 25, 2018, https://www.kff.org/health-costs/press-release/50-state-survey-finds-medicaid-enrollment-tied-to-stronger-economy-and-new-eligibility-systems.
- The Pew Charitable Trusts, “The Trillion Dollar Gap: Underfunded State Retirement Systems and the Roads to Reform” (2010), https://www.pewtrusts.org/~/media/legacy/uploadedfiles/pcs_assets/2010/trilliondollargapunderfundedstateretirementsystemsandtheroadstoreformpdf.pdf.
- Statements 67 and 68 from the Governmental Accounting Standards Board required, among other things, that governments disclose their unfunded pension liabilities on their annual balance sheets and disclose more details on the cost of new pension benefits earned by current workers. Some of the more poorly funded plans now need to use more conservative assumptions to calculate pension liabilities for reporting purposes, and reporting is more closely tied to general accounting standards rather than plans’ individual funding policies.
- Moody’s Analytics, “Pension Risks Remain High After Two Years of Favorable Investment Returns” (2018).
- Moody’s Analytics, “Market Volatility Underscores Risk of High Pension Investment Return Targets” (2019).
Fiscal 50: State Trends and Analysis
Where States Get Their Money, FY 2021
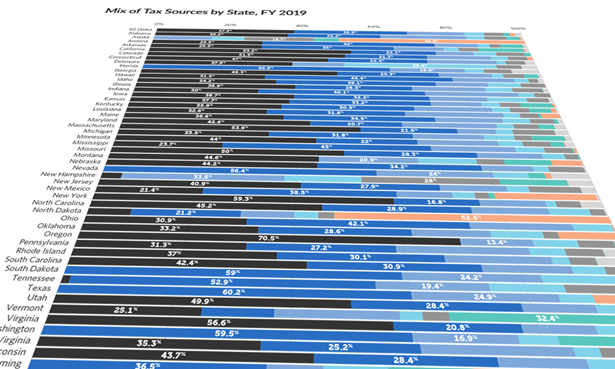
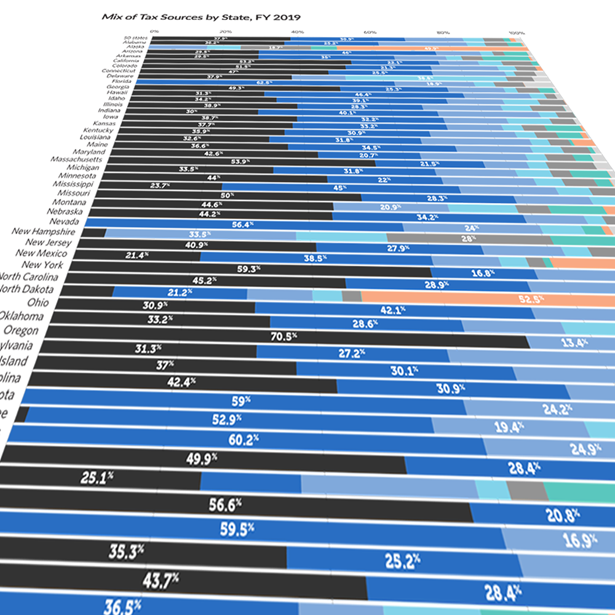
How States Raise Their Tax Dollars, FY 2019


The State Pension Funding Gap 2018


The Pandemic Could Alter Higher Education Spending
ADDITIONAL RESOURCES

Fact Sheet

Podcast